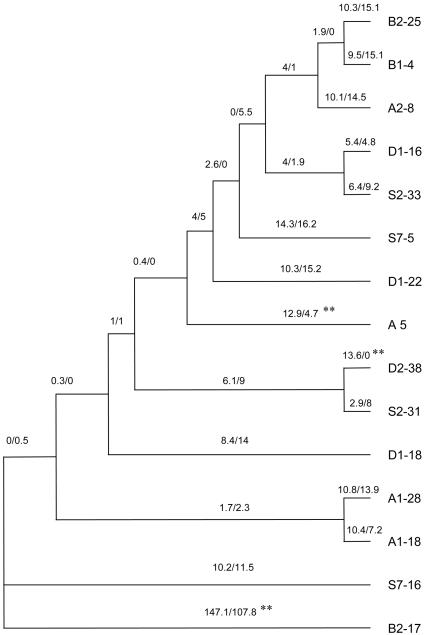
Fig. 3.
Evolutionary tree of csd type I/II alleles. The numbers of nonsynonymous differences (bN) and synonymous differences (bS) per site and for each branch in the genealogy are presented above each branch as bN × 1,000/bS × 1,000 with a transition/transversion ratio of R = 2. The statistical significance was tested with a one-tailed Z test (P < 0.05) and is indicated by asterisks. The tree is unrooted, and its topology differs from that in Fig. 1 because of the omission of replicate variants.

