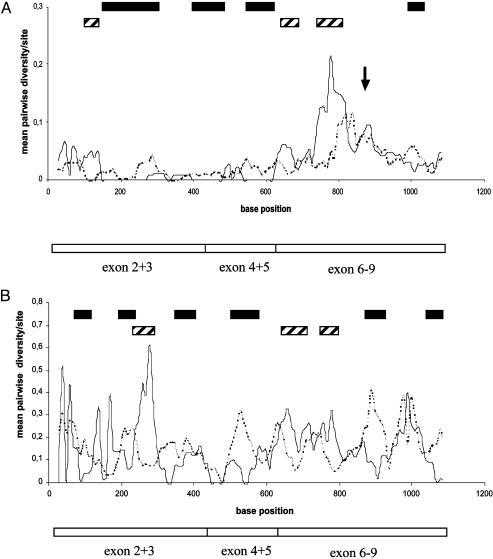
Fig. 4.
Mean pairwise diversity plots of Ks and Ka values, which were constructed for windows of 50 bases sliding along the csd sequence alignment. Only sequences from separate allelic lineages were used in the analysis, which did not include the replicate variants. (A) Average of these statistics for all pairwise comparisons of type I lineages. The arrow indicates the position of the hypervariable repeat region (see Fig. 2) not included in this analysis. (B) The comparison between types I and II. Filled boxes indicate base positions at the middle of the window (step size of 10 bases) in which nonsynonymous differences significantly exceed synonymous differences (one-tailed Z test, P < 0.05). Striped boxes indicate base positions in the sequence in which the reverse significant condition is found (Ks > Ka, P < 0.05).

