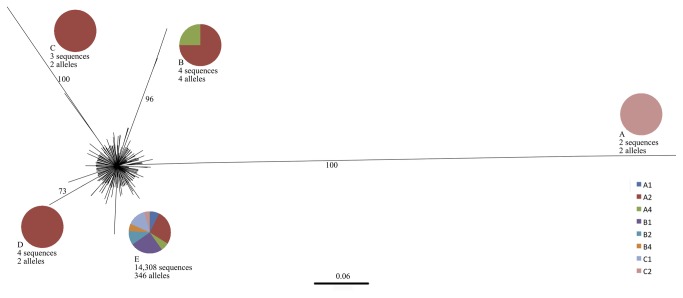
Figure 2. Phylogenetic analysis of genetic divergence between alleles (n=356, f=14,321, 92 nucleotide sites were used).
Evolutionary relationships between alleles were inferred by maximum likelihood based on the Hasegawa-Kishino-Yano model of DNA evolution [46] with a discrete gamma distribution (5 categories (+G, parameter = 11.0677)). Statistical significance was tested with bootstrap replicates (n=1000); only values higher than 70 are depicted. Scale bar indicates number of substitutions per site. Pie charts indicate relative allele provenance for each allele group, as defined by bootstrap values >70.

