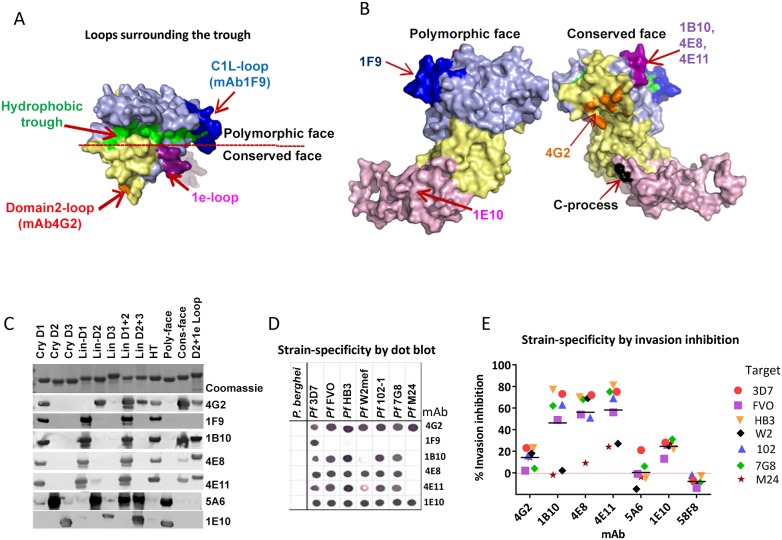
Figure 4. Mapping inhibitory monoclonal antibodies.
(A) View of the hydrophobic trough and the surrounding loops showing approximate spatial location of mAb epitopes. (B) Polymorphic and conserved face of AMA1. Domain-1 residues (light blue); domain-2 (yellow); domain-3 (magenta); C-terminal processing site at residue Thr517 (black); mAb 4G2 binding residues (orange); mAb 1F9 epitope centered on the C1L-loop (dark blue); and mAb 1B10, 4E8 and 4E11 epitopes on the 1e-loop (purple). (C) Coomassie blue stained and western blot panels showing chimeric proteins (Fig. S5) used to map representative mAbs. (D) Dot blot reactivity pattern of inhibitory mAbs against diverse P. falciparum AMA1 allelic proteins and P. berghei AMA1 control. (E) A cross-strain GIA against 7 parasite strains at 1 mg/ml mAb concentration.

