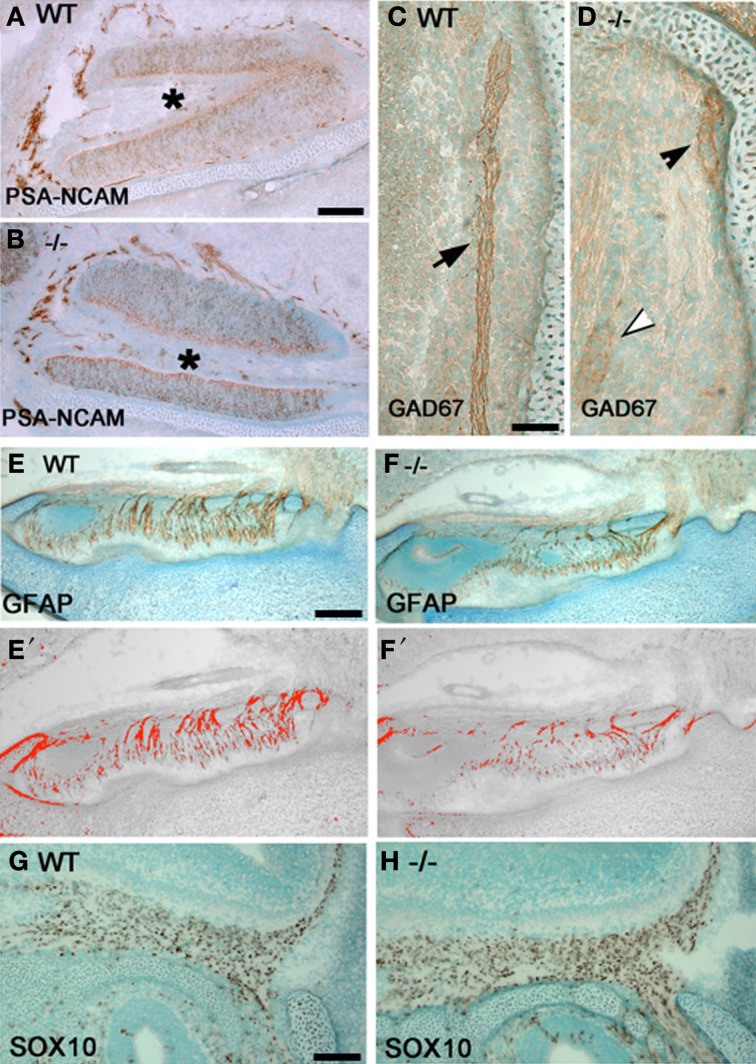
Figure 4.
Olfactory fiber and OECs changes in p75NGFR−/− mice. Sagittal sections close to midline of a p75NGFR−/− (B,D,F,H) embryo and WT littermates (A,C,E,G) showing an area of VNO (A,B) and nasal forebrain junction (C,D,E–H). Sections were immunostained for markers of olfactory axons—PSA-NCAM (A,B) and GAD67 (C,D), and for OECs—GFAP (E,F) and SOX10 (G,H). (E′–F′) are representative transformed images corresponding to (E) and (F), respectively, and were used for measurement of olfactory fiber density; similarly transformed images (not shown) were used in optical density measurement for Sox10 positive cells in (G) and (H). Optical density values from structures other than the fibers were subtracted from the total measurements. (A,B) PSA-NCAM-immuostained fibers around the VNO have similar pattern and intensity between WT (A) and -/- (B) animals. (C,D) GAD67 staining intensity in WT control animals is strong (C, brown, arrow); whereas, variable staining pattern observed in−/− mice (D), from weak (white arrowhead), moderate (black arrowhead) to absent. (E,F) Optical density measurement of GFAP-positive fibers in NFJ showed significant reduction in fiber density of p75−/− mice compared to its WT littermates. (G,H) Optical density measurement of OECs in the NFJ showed increase in staining intensity in -/- mice but cell counts were similar with WT animals. Scale bars: 250 μm.

