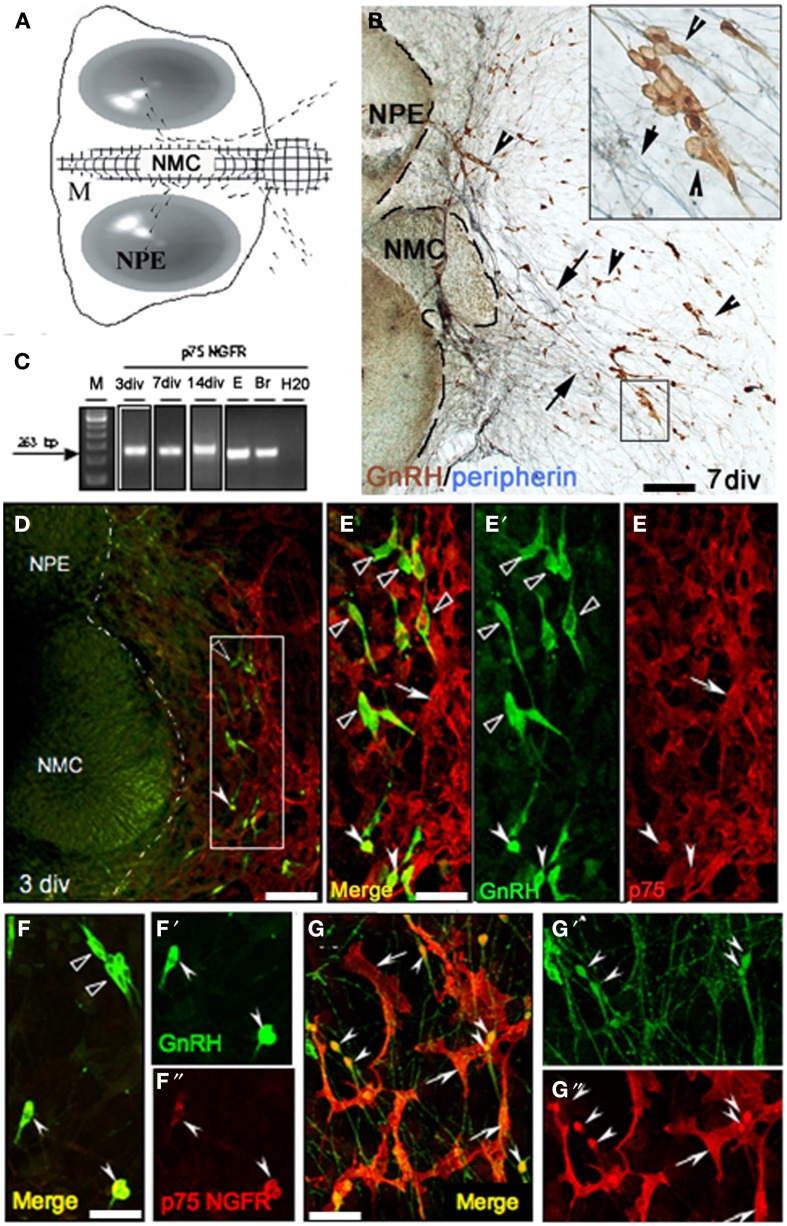
Figure 5.
P75NGFR expression in nasal explants mimics expression in vivo. (A) Schematic of nasal explant showing the migration of GnRH neurons (black dots) across the main tissue mass (M) from the nasal pit/epithelial region (NPE) to the nasal midline cartilage (NMC), and then into the periphery of the explant. (B) Double immunocytochemistry showing GnRH neurons (brown, arrowheads) and peripherin fibers (blue, arrows) on a 7 div nasal explant. At this stage the majority of GnRH neurons have migrated off the main tissue mass into the periphery along peripherin-immunoreactive axons (see insert). (C) Gel documentation of PCR products using specific primers for p75NGFR on single GnRH cell at 3, 7, 14 div, E17.5 head (E) and adult brain (Br). A band of expected size (263 bp) was detected in GnRH cells in nasal explants at all 3 ages. No band was detected in water. (D,E) Double immunofluorescence using antibodies against GnRH (green) and p75NGFR (red) at 3div showed that the majority of GnRH neurons localized proximal to the main tissue mass did not express p75NGFR (E–E″ = high magnification of box area in D, black arrowheads); however, p75NGFR immunoreactivity was detected in some GnRH neurons (E–E″, white arrowheads) and in a multipolar phenotype also out in the periphery of the explant (arrows, E–E′, dashed line in D indicates the border between the tissue mass and the periphery). (F–G″) At 7 div GnRH neurons (green) in the proximal aspect of the periphery of the explant (close to the main tissue mass, F–F″) were either p75NGFR negative (black arrowheads), or showed co-expression of p75NGFR protein (white arrowheads). Distally (G–G″), the expression of p75NGFR in migrating GnRH neurons increased as function of distance from the tissue mass/into the periphery (arrowheads). Note, p75NGFR multipolar positive elements (arrows) were closely associated with both soma and fibers of GnRH neurons. Scale bars: (B,D) = 250 μm; (E–G″) = 50 μm.

