
Figure 4.
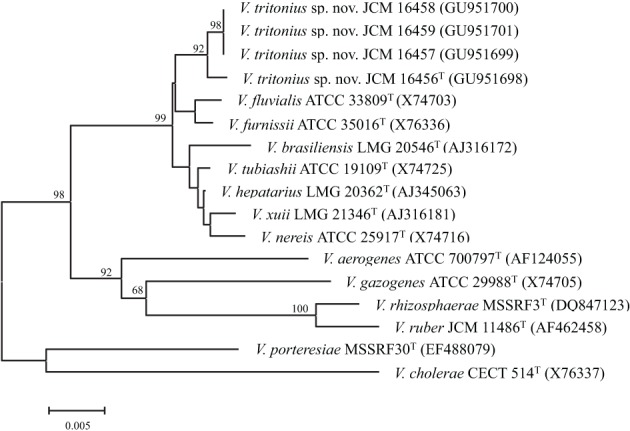
Unrooted phylogenetic tree on the basis of 16S rRNA gene sequences. Scale bar: 0.005 accumulated change per nucleotide. This figure combines the results of three analyses i.e., neighbor-joining, maximum parsimony, and maximum likelihood. The topology shown was obtained using neighbor-joining and 500 bootstrap replications. Percentages indicate the branches that were also obtained both in the maximum likelihood analysis (P < 0.01) and in the most parsimonious tree.