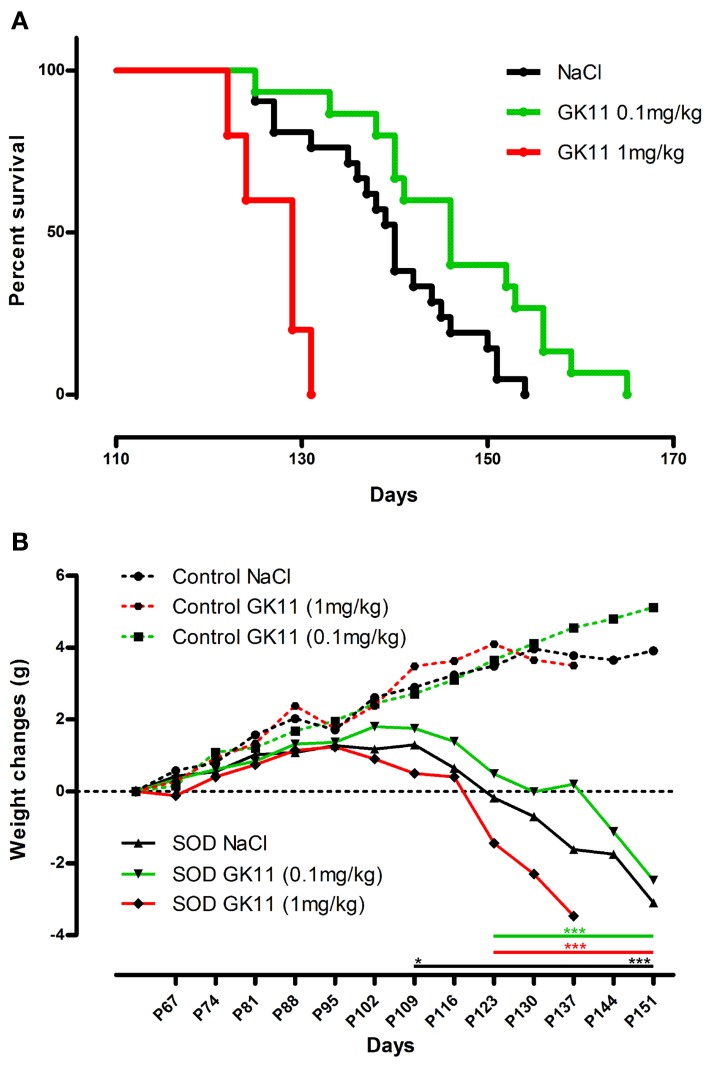
Figure 1.
Dose effect of Gacyclidine on hSOD1G93A mice survival and weight. (A)—Kaplan-Meier curves of hSOD1G93A mice injected i.p with NaCl (n = 21), GK11 0.1 mg/kg (n = 15) or GK11 1 mg/kg (n = 5). (B)—Weight changes (g) in control (dash line) and transgenic mice (continuous line) injected with NaCl, GK11 0.1 mg/kg or GK11.1 mg/kg. Two-ways ANOVA followed by Tukey-Kramer test [F(10, 695) = 96.18]. Weight of NaCl treated controls and transgenics significantly differs from P109 whereas weight of GK11 (both doses) treated controls and transgenics significantly differ from P123. *p < 0.05 and ***p < 0.001.

