Figure 2.
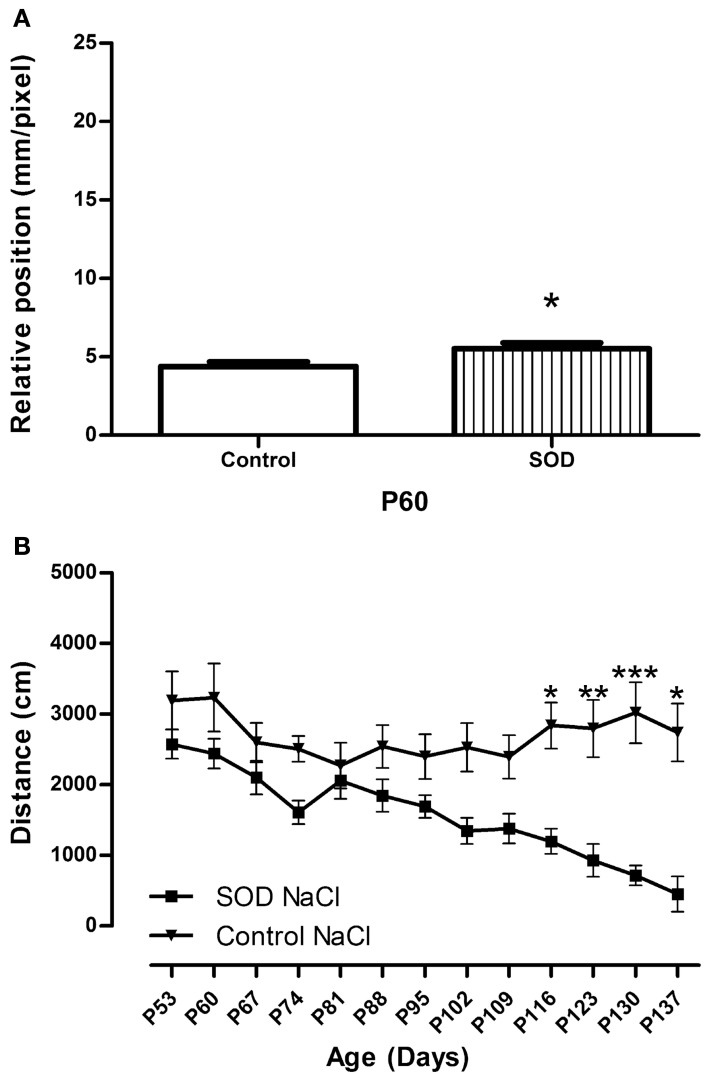
Locomotor function analysis of hSOD1G93A female mice. (A)—CatWalk gait analysis. Graph represent the distance between the front and hind paws on a step sequence (“relative position”) of control females (n = 32) and hSOD1G93Aanimals (n = 41) before treatment. Statistics: t-test: *p < 0.05 (B)—Open field test. Spontaneous locomotor activity represented by the mean distance covered by control female and hSOD1G93A mice in a weekly 8 min recording test over disease progression. For Open field test a minimum of 10 animals were used from day 53 to 130, then due to the death of hSOD1G93A mice, a minimum of 5 animals were analyzed (P137). Statistics: two ways ANOVA followed by Tukey Kramer test. F(12, 262) = 95.95. *p < 0.05, **p < 0.01 and ***p < 0.001.

