Figure 5.
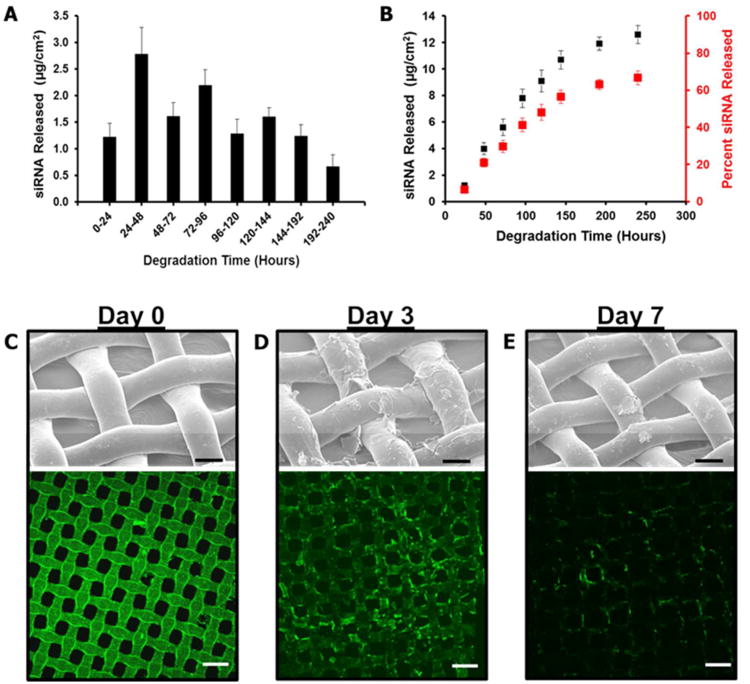
LbL film degradation and release of siRNA. (A) Plot of siRNA release measured on a daily (days 1-6) or bi-daily (days 7-10). Release measured during degradation of FITC-labeled siRNA containing film in cell conditioned media. (B) Cumulative release of siRNA over the 10 day period tested. (C-E) Side-by-side comparison of SEM and confocal imaging showing the break-down of the film on day 0 (C), day 3 (D), and day 7 (E), in cell conditioned media. SEM scale bar = 50 μm, Confocal scale bar = 100 μm.

