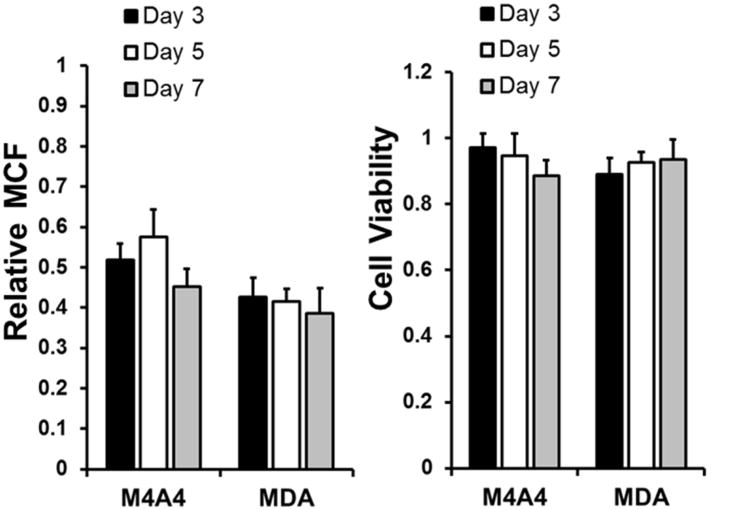
Figure 8.
Knockdown of GFP characterized in two separate cancer cell lines. (A) Flow cytometry measurement of mean cell fluorescence of either MDA or M4A4 cells that constitutively express GFP exposed to GFP-siRNA containing LbL films followed over a 1 week period. Data shown normalized to mean cell fluorescence of cells exposed to siControl containing film of the same architecture. (B) Viability of cells exposed to coated Tegaderm® substrate normalized to cells exposed to uncoated substrates. Viability measured by metabolic assay AlamarBlue.

