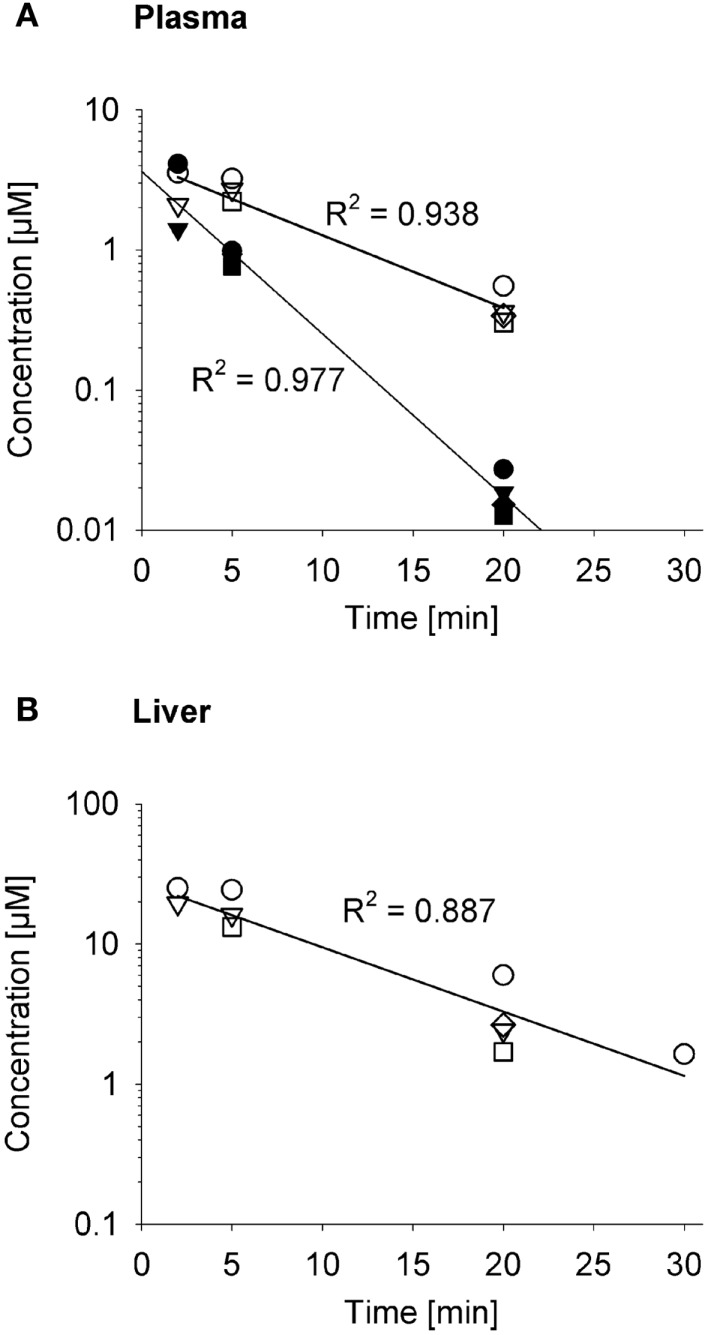
Figure 10.
Pharmacokinetics of PR-104H and its reduction product PR-104M in NIH-III nude mice. Concentrations of PR-104H (filled symbols) and PR-104M (open symbols) in plasma (A) and liver (B) following i.v. administration of 10 μmol/kg PR-104H, with linear regression lines. At each time point different symbols represent data from individual mice.

