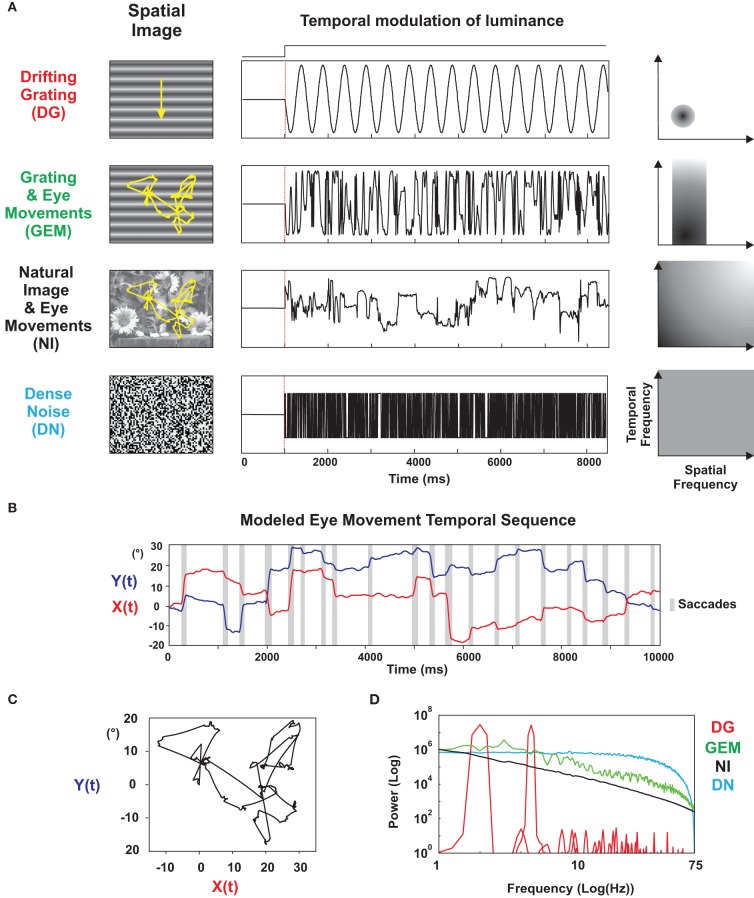
Figure 1.
Parametrization of stimulus statistics. (A) Left column: stimulus set presented to each intracellularly recorded cell. From top to bottom (by increasing order of complexity): (1) Drifting Grating (DG): a sinusoidal grating with optimal spatial frequency and orientation, drifting at optimal temporal frequency; (2) Grating and Eye-movements (GEM): the same grating animated by a trajectory simulating the dynamics of eye-movements; (3) Natural Image (NI) animated with virtual eye-movements; (4) Dense Noise (DN) of high spatial and temporal definition. The variances of the luminance profiles were equalized between stimuli. The presentation was full-field and monocular (through the dominant eye). Middle column: temporal variation of the luminance in a given pixel for each stimulus. Right column: schematic spatio-temporal spectrum (ft, fx) corresponding to each stimulus. (B) Temporal profile of the X and Y coordinates of the modeled eye-movement sequence. Saccadic episodes are indicated by a shaded box. (C) Scanpath generated by the modeled eye-movement sequence. The natural scene image is centered on the RF center at the start of the animation and the same displacement pattern is applied to all cells (“frozen” protocol). (D) Average of the Power spectrum of the luminance variation observed in one pixel for each stimulus condition.

