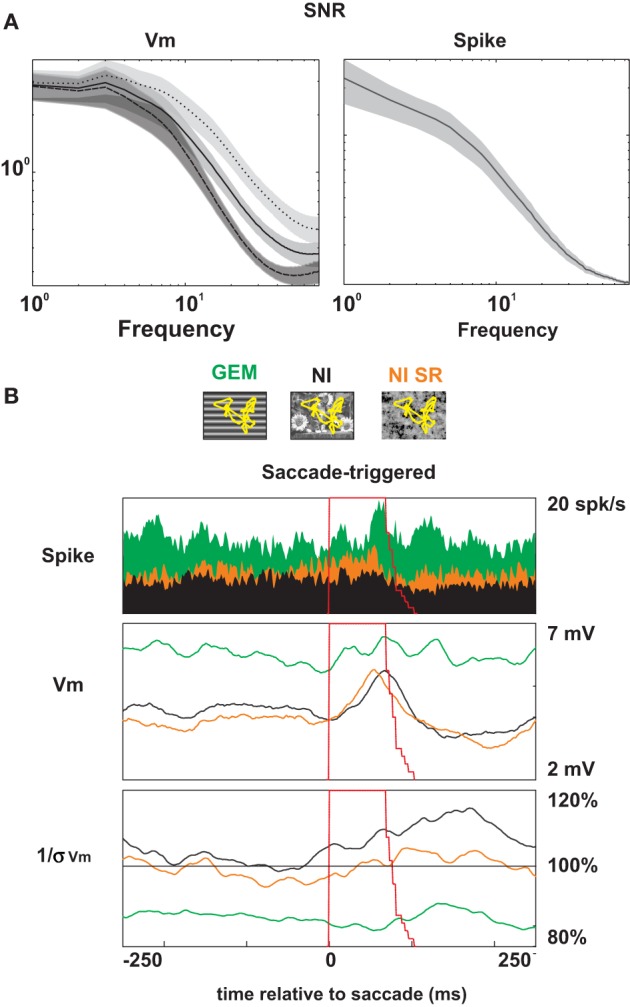
Figure 10.

Population saccade triggered analysis. (A) SNR spectra of the Vm (left) and the spike (right) responses to NI, averaged over saccadic periods (dotted line), fixation periods (dashed line) and the whole presentation (solid line). Shaded areas represent ± 1 s.e.m. Note that the 3 curves are superimposed in the case of the SNR spike. (B) Saccade-triggered averages of the Spike discharge (filled PSTHs in the upper panel), the membrane voltage (middle, Vm) and the inverse of the stimulus-locked standard deviation [right, (1/s [Vm])] responses. The saccade duration distribution tail (dashed red line) is overlaid with these graphs and shown as a stacking of intervals with the same onset, ranging from 70 to 110 ms duration. Three stimulus animation conditions (with saccades) are compared: grating with eye movements (green, GEM), natural image with eye-movements (black, NI) and natural image with eye movements where the spatial phase has been randomized (orange, NI-SR).
