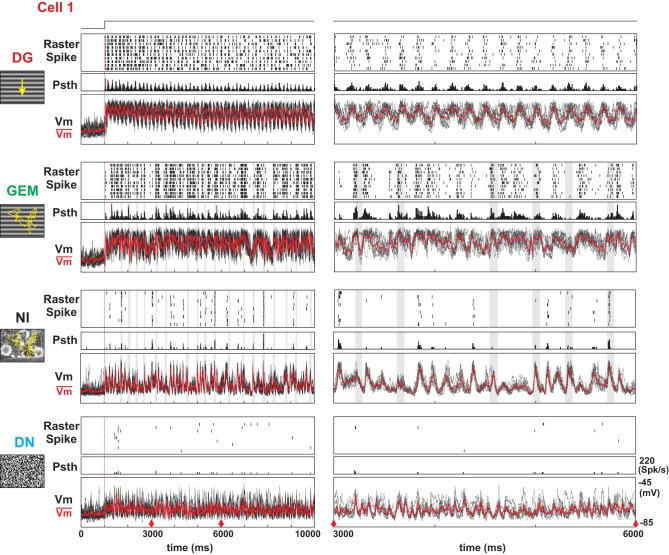
Figure 2.
Dynamics and Reliability of intracellular evoked responses as a function of visual input complexity. Subthreshold intracellular (Vm) and spiking responses of a Simple cell to four types of full screen stimulus animations (indicated at left), at two different temporal magnifications. Left panels: full duration of the responses. Right panels: zoomed in section (3s-long duration, indicated by red arrows). From top to bottom: optimal sinusoidal luminance grating, drifting at 6 Hz (DG); same grating animated by saccadic and fixational eye-movements (GEM); natural image animated by the same sequence of eye-movements (NI); binary dense white noise (DN). For each condition, the three rows represent respectively the trial-by-trial raster of spike trains, aligned with the movie onset (vertical red bar), the PSTH, and the superimposed stimulus-locked Vm trajectories after spike removal of individual trials (black) and their waveform average (in red). Shaded gray stripes indicate saccade occurrence.

