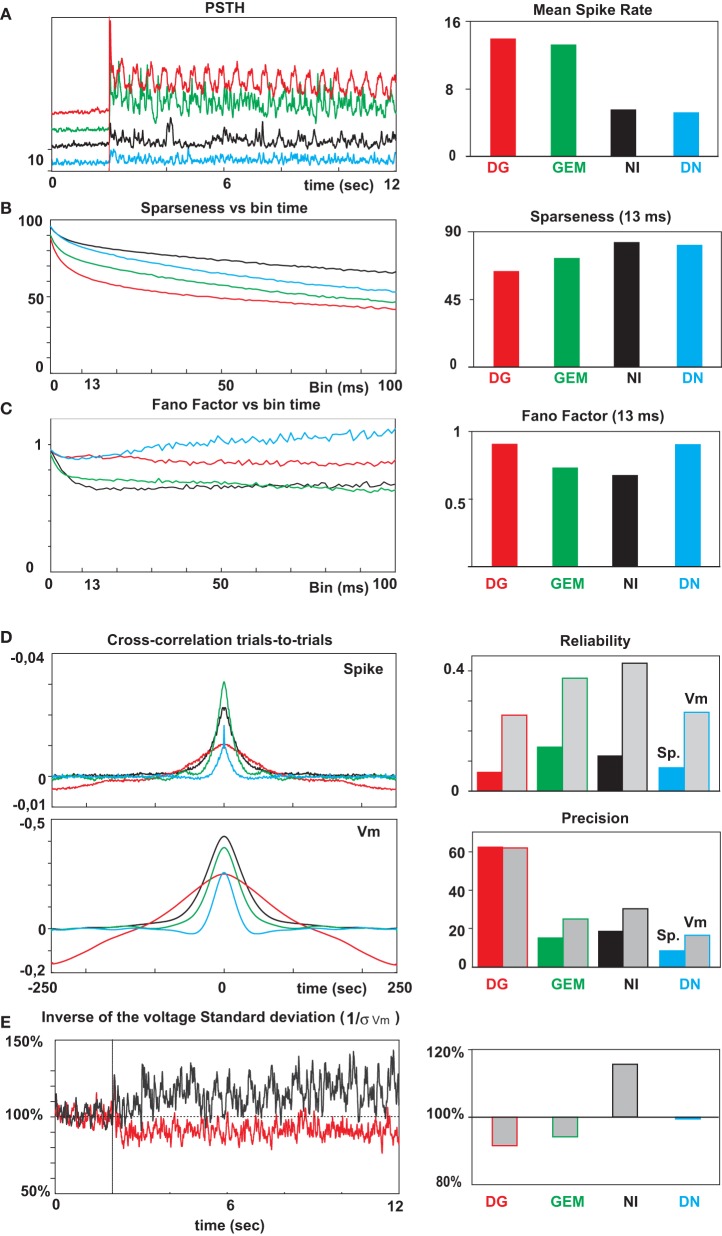
Figure 4.
Mean firing, reliability and temporal precision of spiking events. From top to bottom: (A) Mean spike activity temporal profiles (PSTH) and mean evoked spike rates (right panel) for the each of the 4 stimulus conditions (same color code as in Figure 1). (B) Left, the sparseness index (Vinje and Gallant, 2000) was computed for each condition and its temporal evolution is shown for bin durations ranging from 1 to 100 ms (step of 1 ms). Right, the sparseness mean values, averaged over the whole stimulus presentation, were estimated with a temporal bin equal to twice the screen refresh rate (13.3 ms) used for the temporal animation; (C) Same graphs for Fano factor; (D) Crosscorrelation (CC) functions across trials for spikes (top) and subthreshold Vm activity (bottom). The reliability is given by the peak amplitude at time zero, and the temporal precision by the standard deviation of the Gaussian fit of the CC functions, expressed in ms. (E) Left, the reliability waveforms, estimated by the inverse of the stimulus-locked SD (1/s) across trials, were averaged across the 20 cells after normalization of the basal ongoing level for each cell separately prior to the stimulus onset. Right panel, the relative change from ongoing activity variability is expressed for each of the protocols.

