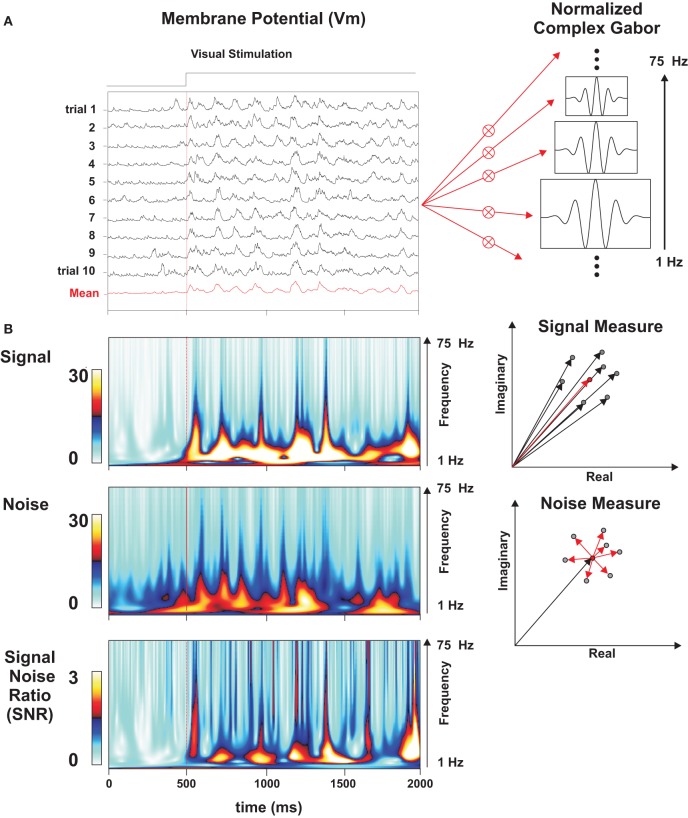
Figure 5.
Wavelet analysis and time-frequency estimation of SNR. (A) Rasters of Vm subthreshold responses for a set of individual trials in a Simple cell (F1/F0 = 1.84, different from that shown in Figure 2) to a grating animated by virtual eye-movements (GEM condition). On the right, schematic representation of an array of Gabor wavelets ranging from 1 to 75 Hz. (B) Time-frequency analysis of the evoked Signal (upper matrix), the Noise (middle), and the SNR (bottom matrix), following the method of Croner et al. (1993). The repetition of the vectorial operations (detailed in the right panels) at all times and frequencies yields the Signal and Noise matrices. The SNR matrix is obtained from point-by-point division of the Signal matrix by the Noise matrix. Reliable events are signaled by hot (red) peaks straddling from low to high frequencies (1–75 Hz). Upper right panel: each black vector represents the result (in the complex plane) of the convolution of the signal with a given wavelet frequency for one particular point in time and a given trial. The red vector represents the mean vector, averaged across all trials, and its squared modulus gives the estimated Signal power. Lower right panel: Noise is measured in the complex plane as the average distance (dispersion) of the individual trial vectors (black vectors) from the mean (red).

