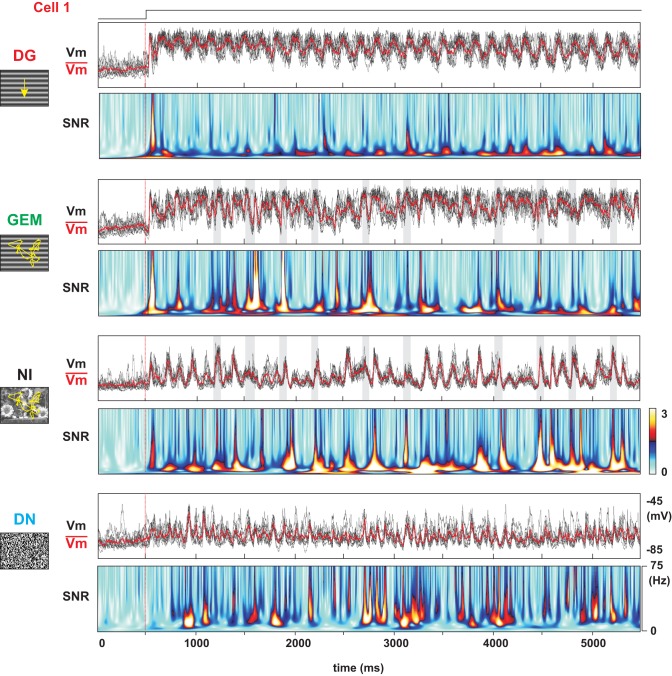
Figure 7.
SNR analysis of the stimulus-dependent reliability of the pre-synaptic bombardment. From top to bottom, subthreshold Vm dynamics and SNR power matrix in another Simple cell for the four stimulus conditions, DG, GEM, NI, and DN. Each panel represents 500 ms of ongoing activity followed by 5 s of continuous visual activation. Note the colored peaks (in the SNR time-frequency matrix) signaling highly temporally structured input in the NI and DN conditions. In the DG condition, the only reliable event is the quenching observed a few tens of ms after at the stimulus onset (red vertical line at 400 ms). The shaded stripes indicate the occurrence of each saccade.

