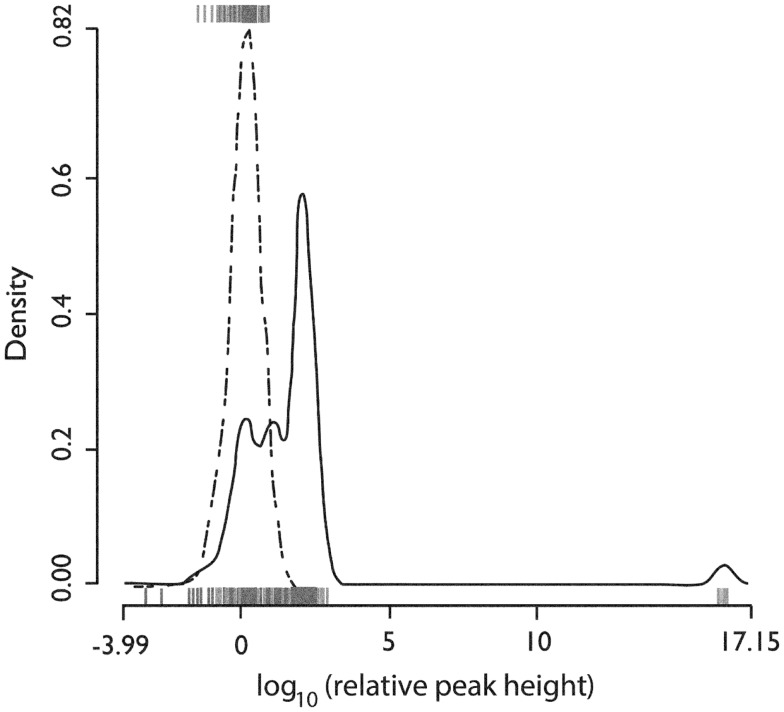
Figure 5.
Distributions of the relative height of the cross-correlogram peak at 0 delay for all recorded pairs of neurons. The distribution for positive peaks is shown by the rug plot on the lower x-axis with an estimated density shown by the solid line (Gaussian kernel with SD = 0.25). The distribution for negative peaks is shown by the rug plot on the upper x-axis with estimated density shown by the dotted line (Gaussian kernel with SD = 0.25). X-axis is the base 10 logarithm of the absolute value of the peak height relative to the standard deviation of cross-correlogram values in a window from 1 to 25 ms delay. Used with permission from Barrow Neurological Institute.

