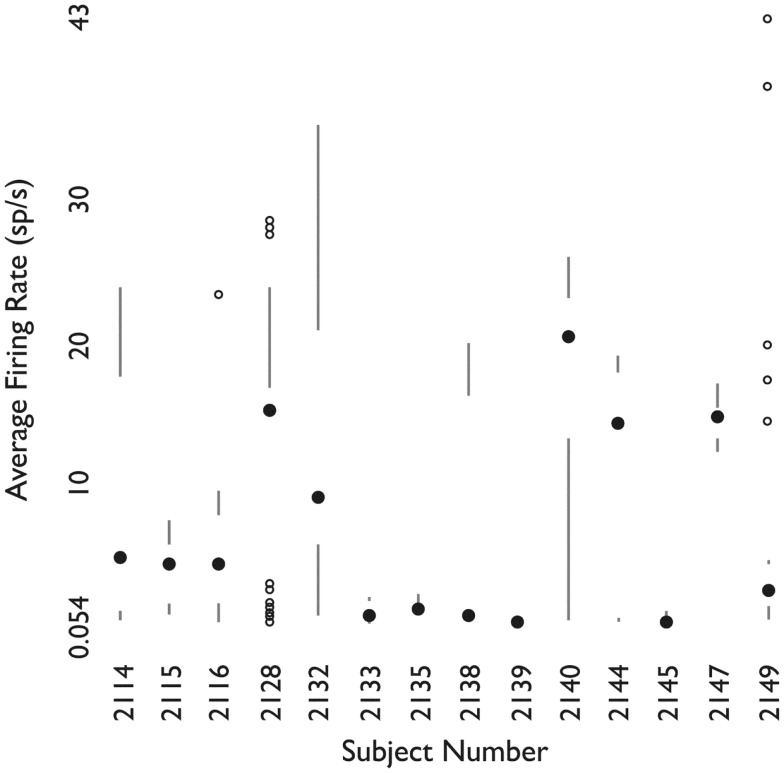
Figure 7.
Firing rates of neurons grouped by patient. For each patient, shown as one column, the filled circle shows the median firing rate. The bars above (below) extend from the third (first) quartile to the data point furthest from the median not more than 1.5 times the inter-quartile range from the median. Points further from the median are shown as small open circles. Used with permission from Barrow Neurological Institute.

