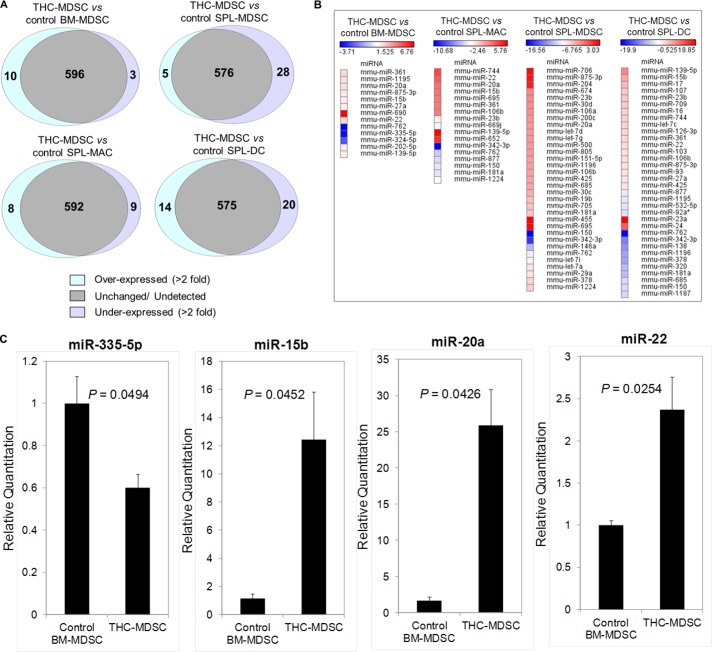
FIGURE 4.
Differential expression of miRNA in THC-induced functional MDSCs. A, Venn diagrams representing number of up-regulated, down-regulated, and unchanged mouse miRNA in THC-MDSC compared with control myeloid cells as indicated. B, heat map of fold changes of differentially expressed miRNA in THC-MDSC showing >2-fold difference in expression as compared with control myeloid cells. C, real time qPCR validation. Total RNA from THC-MDSC and control BM-MDSC were analyzed for the indicated mouse miRNA expression by real time quantitative PCR normalized to internal control RNU-1A. Total RNA isolated from two or three independent cell sorts from groups of up to five mice for each sample were analyzed separately, and standard deviations are represented as error bars.

