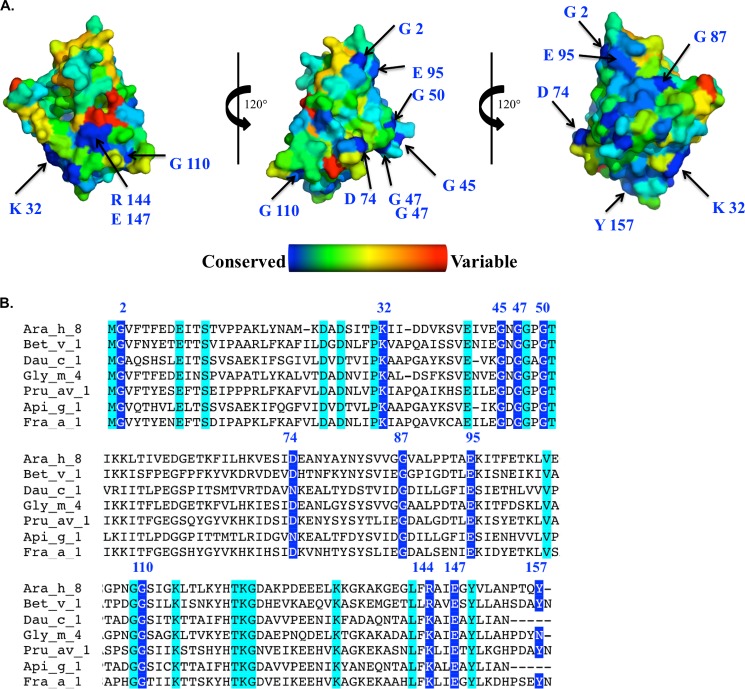
FIGURE 8.
A, surface representation of Ara h 8 showing conserved residues derived from an alignment of 500 Ara h 8-related protein sequences. The most conserved residues are shown in blue, whereas the most variable residues are shown in red. B, multiple-sequence alignment of Ara h 8. The most conserved residues are highlighted in blue, and their position is indicated on the structures above. Residues highlighted in cyan are conserved among PR-10 allergens for which there are available structures in the Protein Data Bank.

