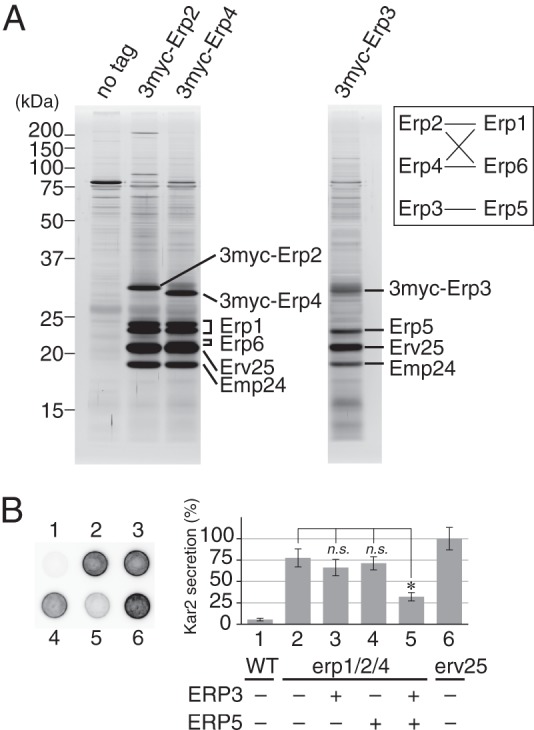
FIGURE 3.

Physical interactions among p24 proteins. A, coprecipitation of p24 proteins with p24γ isoforms. ER-enriched P13 fractions were prepared as described under “Experimental Procedures” from cells expressing 3myc-tagged p24γ (Erp2, Erp3, or Erp4). The tagged p24γ proteins in the P13 fraction were solubilized with 1% (w/v) Triton X-100 and immunoprecipitated with anti-myc-agarose beads. Immunoprecipitated proteins were separated by SDS-PAGE and detected by silver staining. The protein identity shown in the figure was inferred from the result of the mass spectrometry (Table 4) and Western blot analysis. Erp1 was separated as a doublet for unknown reasons. The identities of these two bands were individually confirmed by mass spectrometric analysis. We could not clearly identified the band of Erp6 protein in the silver-stained gel, but because the gel fragment containing Erv25 gave mass signals of Erp6, we speculate that the band overlapping with that of Erv25 and slightly less mobile represents Erp6. The band of 3myc-Erp3 was also not clearly visible, most likely because it overlapped with those of proteins of unknown identity. The inset shows a schematic representation of the observed interactions (solid lines) between p24α and -γ isoforms. B, partial restoration of erp1Δ erp2Δ erp4Δ mutation by simultaneous overexpression of ERP3 and ERP5. Kar2 secretion was assayed as in Fig. 1A. The graph represents the relative amount of secreted Kar2, in which the average amount of Kar2 from erv25Δ cells was set to 100%. Column (spot) 1, wild-type cells carrying the empty vector. Column 2, erp1Δerp2Δerp4Δ cells carrying the empty vector. Columns 3–5, erp1Δerp2Δerp4Δ cells overexpressing ERP3 (column 3), ERP5 (column 4), or both (column 5). Column 6, erv25Δ cells carrying the empty vector. Error bars represent S.E. (n = 4). The asterisk indicates p < 0.05; n.s., not significant.
