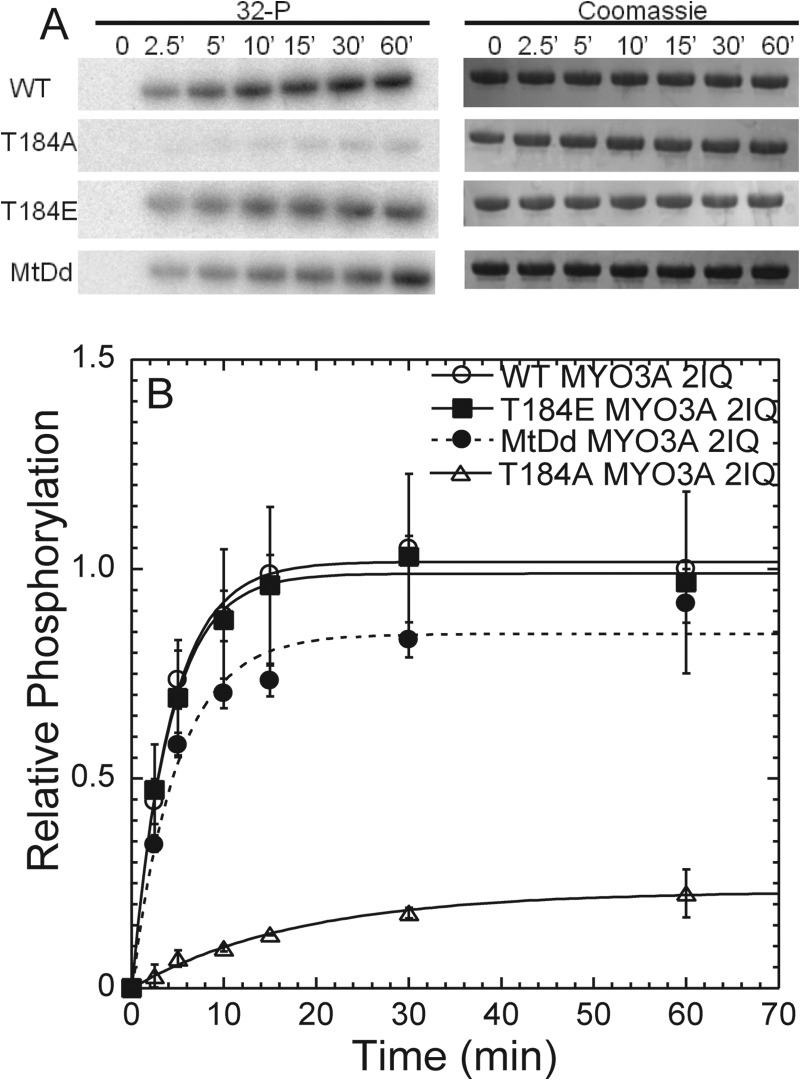
FIGURE 3.
Phosphorylation of Thr-184 regulates MYO3A kinase activity. A, phosphorylation was measured by examining [32P] incorporation with phosphorimaging following SDS-PAGE. Gels were also Coomassie-stained to determine evenness of loading, and bands were excised and examined by scintillation counting (Table 2). B, phosphorylation time course demonstrates the relative intensity of the bands from the phosphorimage during the 60-min time course. The phosphorylation time courses of T184E, T184A, and motor-dead (MtDd) are compared with WT MYO3A. The intensities are plotted relative to the WT MYO3A 60-min time point for comparison. Error bars represent the standard error from four experiments.

