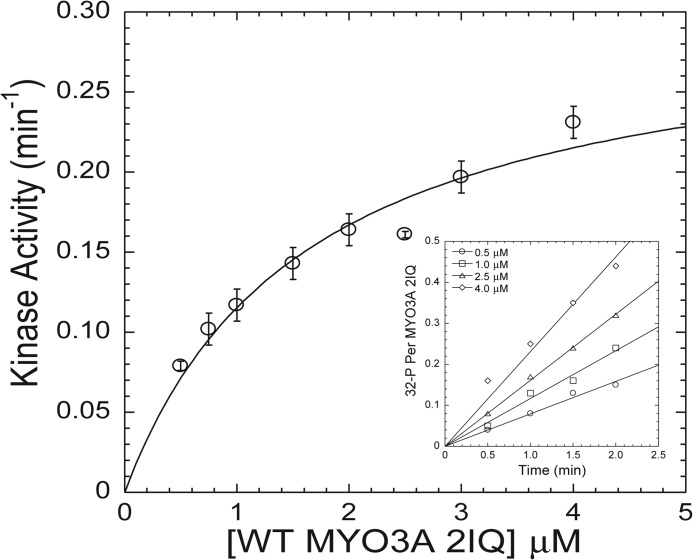
FIGURE 5.
Steady-state kinase activity of WT MYO3A 2IQ. The initial velocity of the kinase reaction ([32P] incorporation) was monitored as a function of WT MYO3A 2IQ concentration and fit to the Michealis-Menten relationship to determine kcat and Km values. The inset demonstrates the linear fits of the kinase reaction time courses that determined the initial velocity of the kinase reaction for four different concentrations of WT MYO3A 2IQ. The error bars represent the standard errors from the linear fits of the initial velocity measurements.

