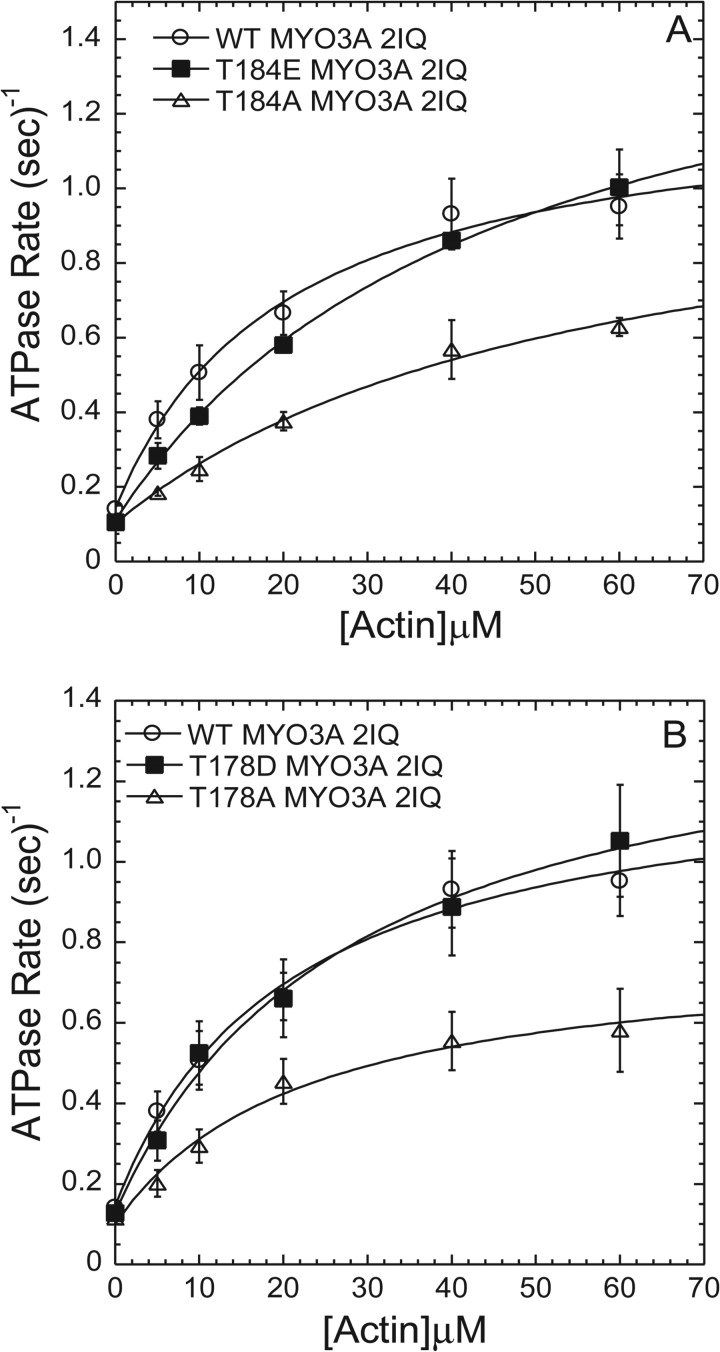
FIGURE 6.
Actin-activated ATPase activity of MYO3A 2IQ phosphorylation site mutations. Both T184A MYO3A2IQ and T184E MYO3A2IQ displayed an increased KATPase when compared with WT MYO3A2IQ. The T184A and T178A MYO3A2IQ mutants displayed a decrease in kcat compared with WT MYO3A 2IQ. Data represent averages from three to five separate experiments (error bars represent mean ± S.E.) and are summarized in Table 3.

