
FIGURE 6.
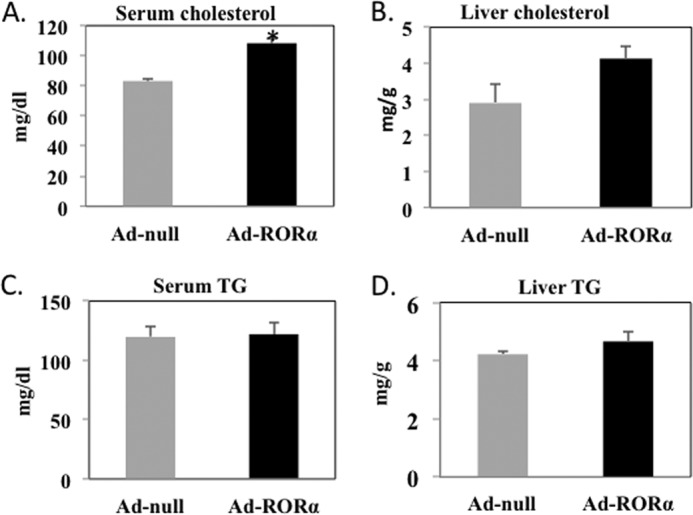
Analysis of lipid profile of mice transfected with Ad-RORα. A, serum cholesterol. B, liver cholesterol. C, serum triglyceride. D, liver triglyceride. Wild type C57BL6 mice (n = 5 to 6) were injected with Ad-RORα or Ad-null as described under “Experimental Procedures.” Seven days post injection mice were fasted overnight. Fresh serum and livers were obtained for analysis of triglyceride (TG) and cholesterol as described under “Experimental Procedures.” Results are expressed as the mean ± S.E.; n = 5; the asterisk indicates statistical significance, p < 0.05, Ad-RORα versus Ad-null infected mice.