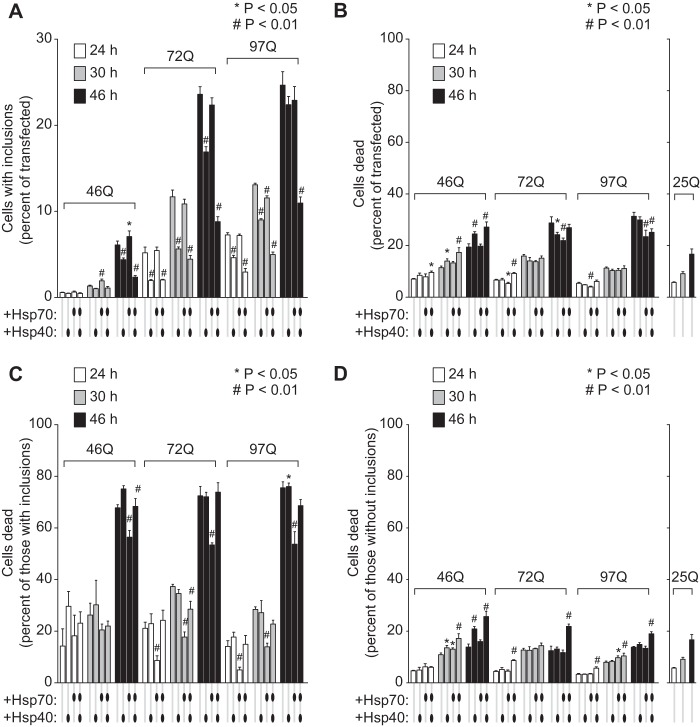
FIGURE 4.
hsp40 and hsp70 dictate divergent outcomes to inclusion formation rates and toxicity. A, flow cytometry data of all cells expressing the Httex1TC9-Cerulean from the IRES mKate2-F vector as proportion of inclusions (i population). Different variants of this construct with 46Gln, 72Gln, and 97Gln are shown and for cells collected at different time points post-transfection. The cotransfections were performed as described in Fig. 3 legend (n = 3, mean ± S.D. shown). Three-way ANOVA for each chaperone treatment against Htt alone for all Gln length and time points are as follows: hsp40 (p < 0.001), hsp70 (p = 0.014), and hsp40 and hsp70 (p < 0.001). Individual pairwise comparisons against Htt alone as control are shown for p < 0.05. B, death rate for the cells. Death rates were determined as the number of free inclusions (D population), leached cells (L population), and further cells reactive to SYTOX Dead Red (n = 3, mean ± S.D. shown). Three-way ANOVA for each chaperone treatment against Htt alone for all Gln length and time points are as follows: hsp40 (p = 0.949), hsp70 (p < 0.001), and hsp40 and hsp70 (p < 0.001). Individual pairwise comparisons against Htt alone as control are shown for p < 0.05. C, death rate for cells that have formed inclusions (i.e. the i population). Three-way ANOVA for each chaperone treatment against Htt alone for all Gln length and time points are as follows: hsp40 (p = 0.004), hsp70 (p < 0.001), and hsp40 and hsp70 (p = 0.220). Individual pairwise comparisons against Htt alone as control are shown for p < 0.05. D, death rate for transfected cells lacking inclusions (ni population). Three-way ANOVA for each chaperone treatment against Htt alone for all Gln length and time points are as follows: hsp40 (p = <0.001), hsp70 (p = 0.002), and hsp40 and hsp70 (p < 0.001). Individual pairwise comparisons against Htt alone as control are shown for p < 0.05.

