FIGURE 5.
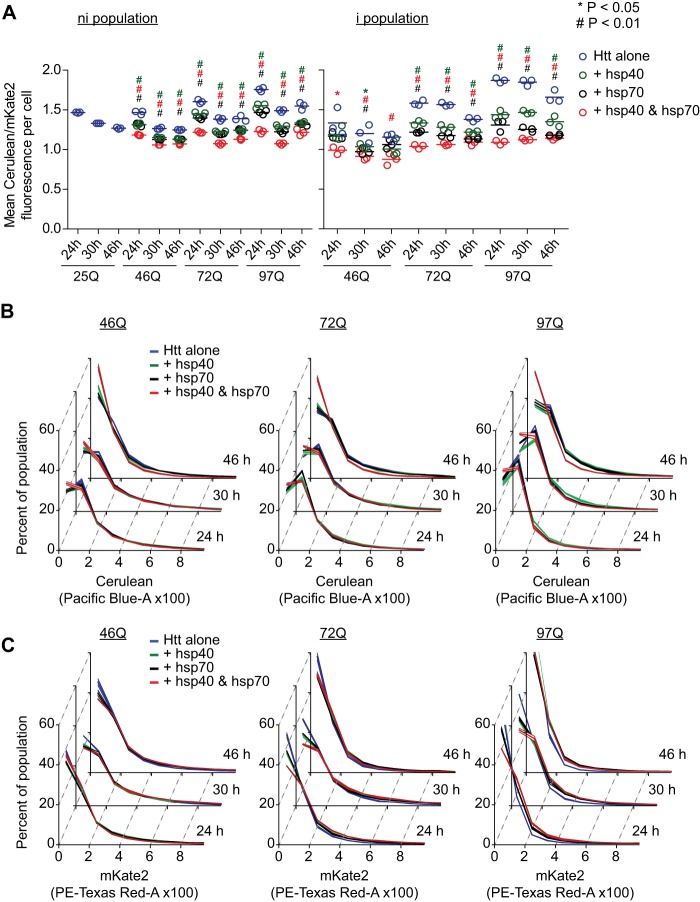
Chaperone treatment reduces Httex1 abundance and increases reporter mKate2. A, data show population means of mKate2-F/Cerulean for flow cytometry data in the M gate (see Fig. 1) subdivided into cells lacking inclusions (ni population) and those with inclusions (i population). Mean of the three replicates shown as bars. Treatments are as described in Fig. 3 legend. B, absolute abundance of Httex1-Cerulean in the cell population as assessed by Cerulean fluorescence histograms. Treatments are as described in Fig. 3 legend. Data show mean (central lines) ± S.D. (outer boundaries); n = 3. For ANOVA, individual pairwise comparisons against Htt alone as control are shown for p < 0.05. C, absolute abundance of mKate2 in the cell population as assessed mKate fluorescence histograms. Treatments are described in Fig. 3 legend. Data show mean (central lines) ± S.D. (outer boundaries); n = 3. For ANOVA, individual pairwise comparisons against Htt alone as control are shown for p < 0.05.

