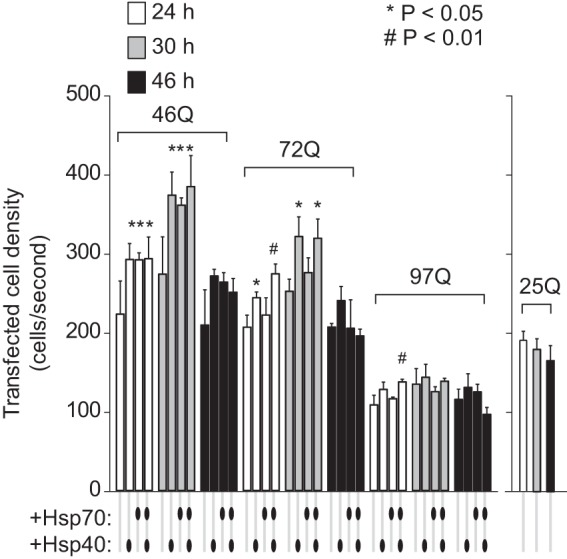
FIGURE 8.

hsp40 and hsp70 influence on cell number in population. The relative populations of cells were estimated based on the density of cells in solution for flow cytometry analysis. This was assessed by counting the cell counts per standard flow rate for the transfected population. For 46Gln and 97Gln, n = 3, mean ± S.D. shown. For 25Gln, n = 2, mean ± S.D. shown. For ANOVA, individual pairwise comparisons against Htt alone as control are shown for p < 0.05.
