
FIGURE 1.
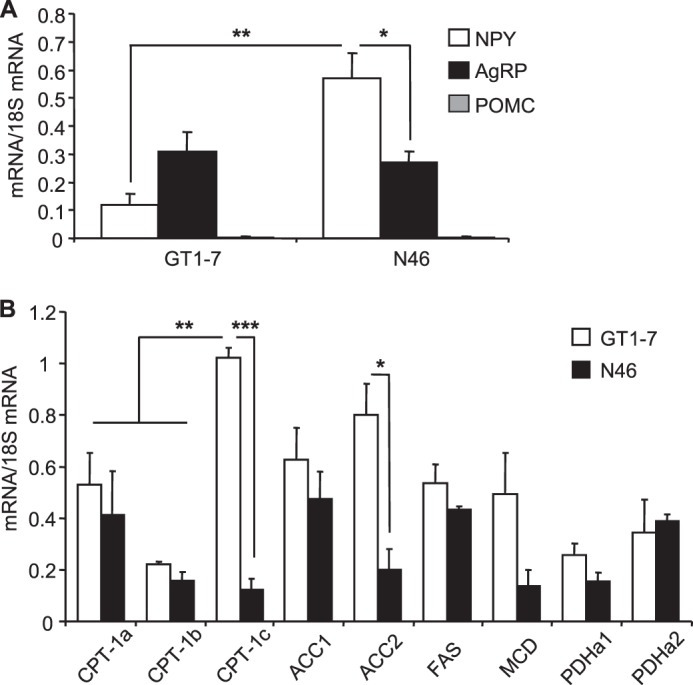
Neuropeptides and metabolic enzymes expression profiles in GT1-7 and N46 hypothalamic neurons. Neuropeptides (A) and enzymes (B) expression was determined by qPCR, and mRNA levels were normalized to 18 S levels. AgRP, NPY, pro-opiomelanocortin (POMC), CPT-1, ACC, fatty acid synthase (FAS), MCD, pyruvate dehydrogenase (PDH). Results are shown as means ± S.E. n = 3–5 performed in duplicate. Statistical analyses were performed with one-way ANOVA with Bonferroni post-tests. *, **, and ***, p < 0.05, 0.01, and 0.001, respectively.