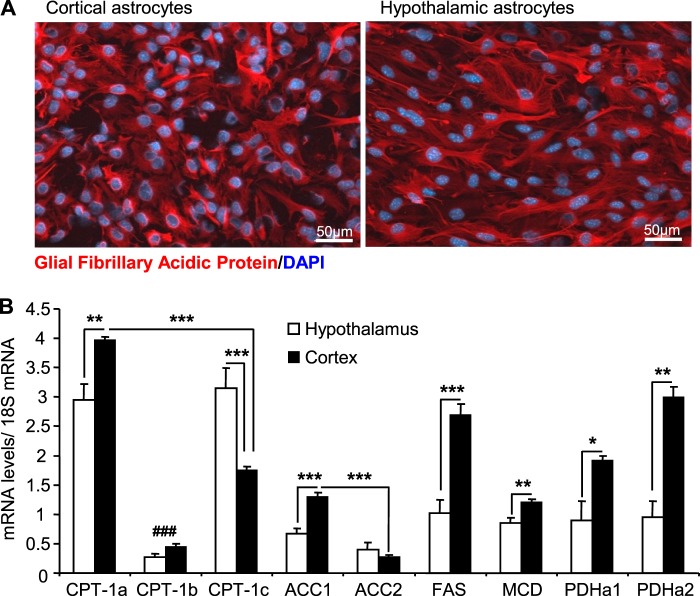
FIGURE 3.
Glial fibrillary acidic protein and metabolic enzymes expression profiles in hypothalamic and cortical astrocytes. A, Glial fibrillary acidic protein (GFAP) and DAPI immunostaining in cortical (left) and hypothalamic (right) astrocytes. B, enzyme expression was determined by qPCR, and mRNA levels were normalized to 18 S levels. CPT-1, ACC, fatty acid synthase (FAS), MCD, pyruvate dehydrogenase (PDH). Results are shown as the means ± S.E. n = 5 performed in duplicate. Statistical analyses were performed with one-way ANOVA with Bonferroni post-tests. *, **, and ***, p < 0.05, 0.01, and 0.001, respectively. ###, p < 0.001 versus CPT-1a and -1b.

