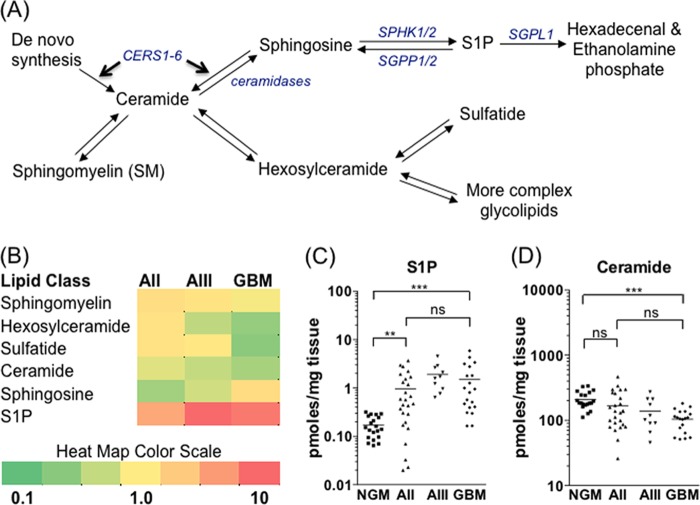
FIGURE 1.
S1P/ceramide balance shifts as a function of glioma malignancy. A, schematic of basic sphingolipid metabolism. Enzymes controlling the balance between ceramide and S1P are shown in blue italics. Entry into the pathway occurs through de novo synthesis of ceramides by ceramide synthases 1–6 (CERS1–6). B, heat map showing the relative abundance of different sphingolipid metabolites among the four sample groups: NGM (n = 20), AII (n = 26), AIII (n = 10), and GBM (n = 20). Each square is the mean of all samples in that group divided by the mean of the control NGM group. Red indicates increased and green indicates decreased abundance for each metabolite shown. S1P (C) and total ceramide (D) levels in individual tissue samples. Statistical significance was tested as described under “Experimental Procedures” (*, p < 0.05; **, p < 0.01; ***, p < 0.001; ns, not significant). For clarity of presentation, only significance of comparisons between NGM, AII, and GBM is shown.

