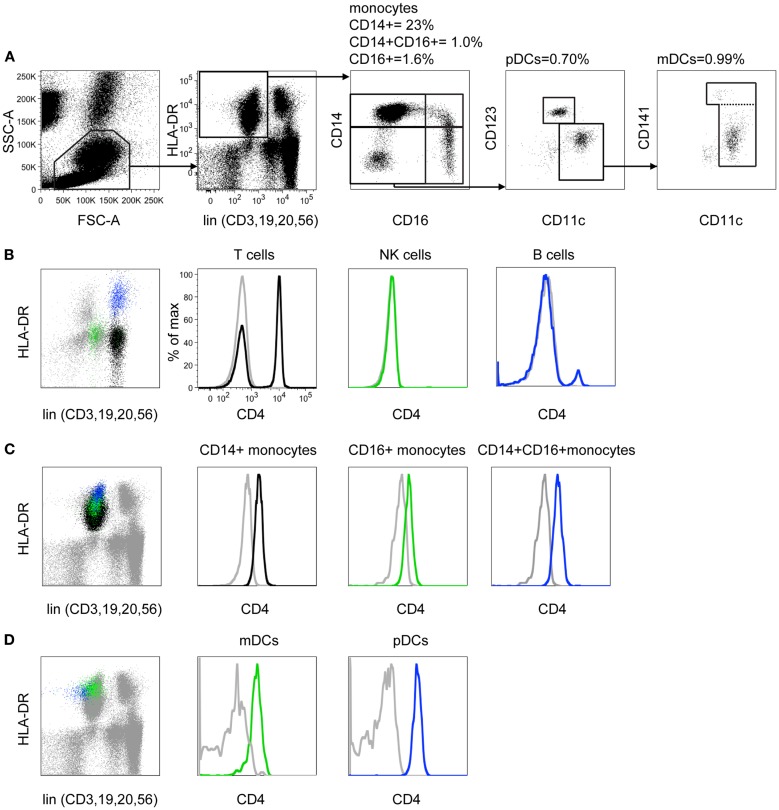
Figure 1.
CD4 is differentially expressed on monocytes and DCs. (A) In an 8-color DC profiling panel FSC and SSC parameters are used to distinguish mononuclear cells from granulocytes, counting beads, and debris. Mononuclear cells are confirmed as CD45+ SSC low (gate not shown). Lineage markers (CD3, 19, 20, 56) are used to remove T, B, and NK cells from analysis and DR+ monocytes and DCs are selected. The CD14 vs. CD16 plot reveals three subsets of monocytes and CD14− CD16− DCs. Plasmacytoid DCs are defined as CD11clow CD123+. Two subsets of CD11c myeloid DC are split by CD141. Percentage values shown indicate the proportion of gated cells relative to CD45+ SSC low cells. (B) CD3+ T cells (black), CD56+ NK cells (green), and CD19+ B cells (blue) are back-gated onto the lineage vs. DR plot to demonstrate the locations of these populations. Expression of CD4 was then tested (colored histograms) relative to isotype control (gray). Note that a small population of activated DR+ CD4+ T cells overlaps the B cell population. (C) CD14+ monocytes (black), CD16+ monocytes (green), and CD14+16+ monocytes (blue) are back-gated onto the lineage vs. DR plot. Expression of CD4 is shown (colored histograms), relative to isotype control (gray). (D) Myeloid DC (green) and plasmacytoid DC (blue) are back-gated onto the lineage vs. DR plot. Expression of CD4 is shown (colored histograms), relative to isotype control.

