Figure 2.

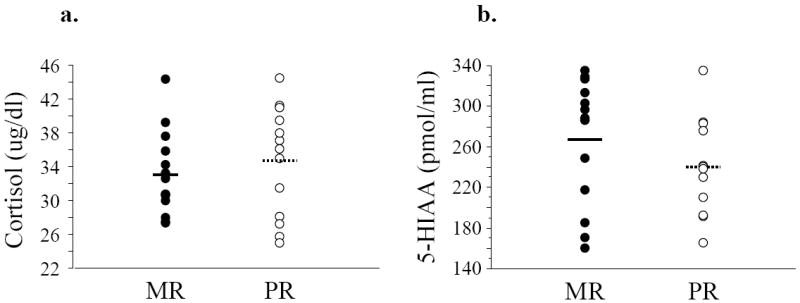
Cortisol (a) and 5-HIAA (b) scatter plots of individual subjects in the MR and PR group, with means plotted as horizontal lines.

Cortisol (a) and 5-HIAA (b) scatter plots of individual subjects in the MR and PR group, with means plotted as horizontal lines.