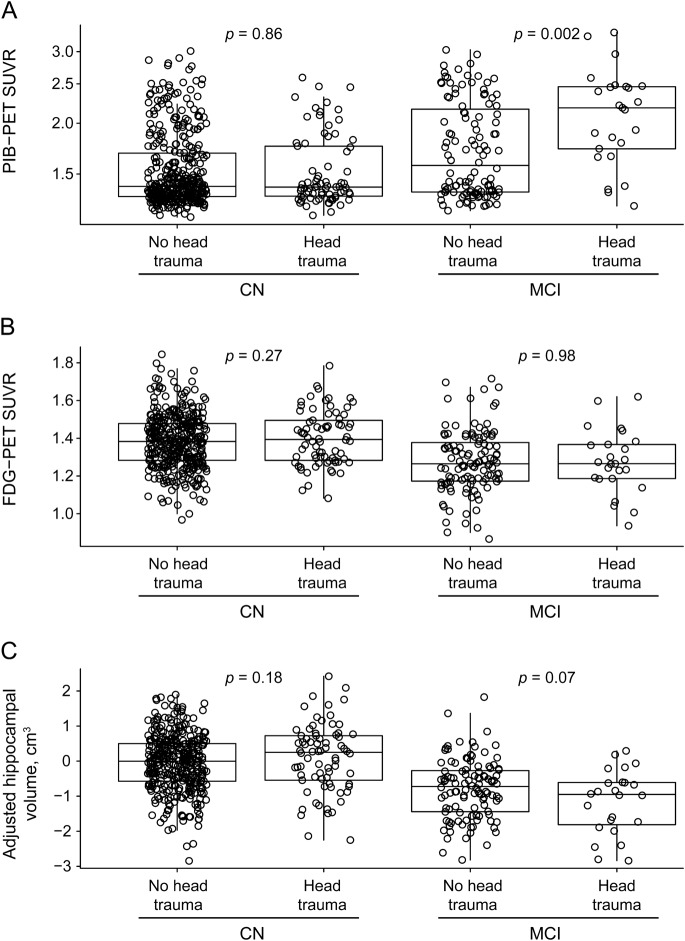
Figure. PiB-PET, FDG-PET, and adjusted hippocampal volume by cognitive status and history of head trauma.
Box plots with superimposed data points for PiB-PET (A), FDG-PET (B), and adjusted hippocampal volume (C). The p values indicate the difference between those with and without head trauma based on linear regression models adjusted for age and sex. Boxes indicate the median and quartiles, with vertical “whiskers” extending to the nearest data point within 1.5 times the value of the interquartile range. CN = cognitively normal; FDG = fluorodeoxyglucose; MCI = mild cognitive impairment; PiB = Pittsburgh compound B; SUVR = standardized update value ratio.

