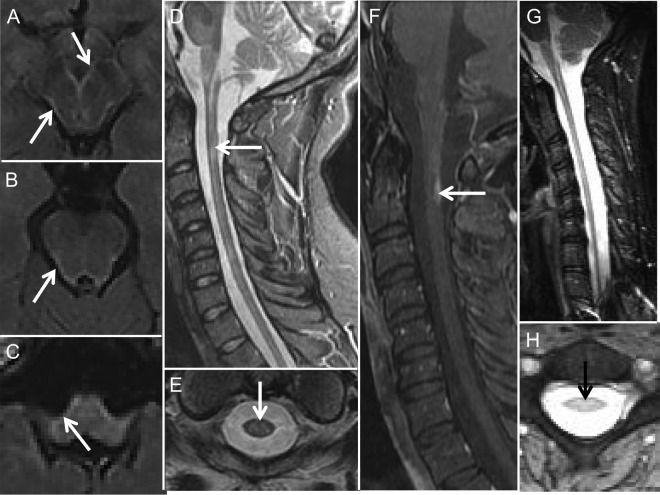
Figure 1. MRI features in Alexander disease: Brainstem and spinal cord features.
(A–C) Axial fluid-attenuated inversion recovery (FLAIR) MRIs from case 7 showing the pial FLAIR signal change (arrows) along the midbrain (A), pons (B), and medulla (C). Sagittal (D) and axial (E) T2-weighted MRIs from case 5 showing an area of intramedullary signal change and moderate cord atrophy. Sagittal T1 with contrast cervical spine MRI (F) from case 7 showing a dorsally located region of subpial enhancement in the upper cervical cord. Sagittal (G) and axial (H) cervical cord MRIs from case 9 showing cord atrophy (G, H) and intramedullary signal change (H).

