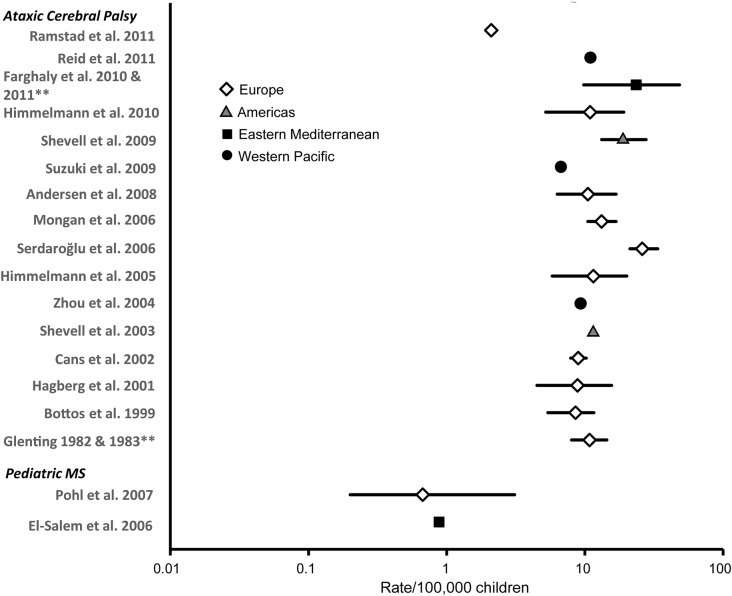
Figure 5. Prevalence of ataxias of mixed etiology (i.e., genetic and environmental) in children (rate/100,000 and 95% confidence interval).
Each symbol represents the prevalence estimate from a specific World Health Organization (WHO) region. Different symbols represent different WHO regions. Prevalence rates are plotted on a logarithmic scale because of the large range of rates reported. **Two articles report on same dataset. For citations, see appendix e-2. MS = multiple sclerosis.

