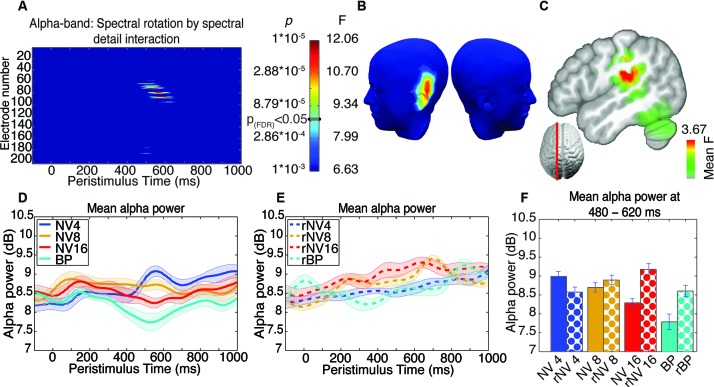
Figure 5.
Results of ANOVA of induced activity in the alpha-band. (A) Electrode-by-time plot of the p-values for the interaction of rotation × spectral detail with corresponding F- and p-values, thresholded at p = 0.001, revealing the time-window of interest (462–633 ms). The color bar indicates the corresponding F- and p-values, the threshold for p(FDR) < 0.05 is indicated. (B) Topography of this effect, using the same color scale as in (A) at the peak of the effect (533 ms), indicating a contribution of left-temporal sources. (C) Localization of this effect in the inverse space, the main source being in the left supramarginal gyrus extending into left inferior parietal and superior temporal structures, showing the average F-statistic over the time-window of interest. (D) Average time-course of this effect in a cluster of five contributing electrodes across NV conditions, demonstrating enhanced alpha-band suppression for more intelligible conditions. (E) Corresponding time-courses for the spectrally rotated conditions, where the effect of spectral detail is absent. (F) Alpha-band activity for each condition in the significant time-window, error bars represent standard error of the mean corrected to be appropriate for repeated-measures comparisons, as described in Loftus and Masson (1994).

