Figure 10.
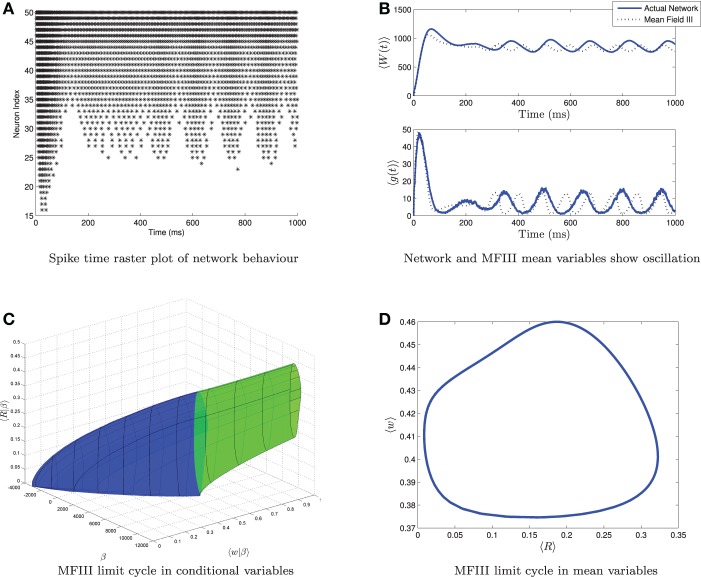
Visualizing a limit cycle in a heterogeneous network. Numerical simulation of MFIII and a network of 1000 neurons with heterogeneity in the applied current. Parameters are as given in Table 1 except gsyn = 200 nS, 〈Iapp〉 = 1000 pA and σI = 4400 pA. (A) Raster plot for 50 randomly selected neurons of the network arranged in order of increasing current. Some of the neurons are bursting, while others are tonically firing, albeit with an oscillatory firing rate. (B) In the mean variables, the steady state behavior of both the network and MFIII is an oscillation. (C) As MFIII is a partial differential equation, the steady state “limit cycle” is actually a manifold of limit cycles, foliated by the heterogeneous parameter β = Iapp. Part of the manifold has cycles with 〈R|β〉 = 0 for an extended period of time (in blue). The other part contains limit cycles that have 〈R|β〉 ≠ 0 during the entire oscillation. We can classify neurons with the parameter values in blue as bursting, and those in green as oscillatory firing. (D) Averaging the limit cycle in (C) with respect to β yields the mean limit cycle.

