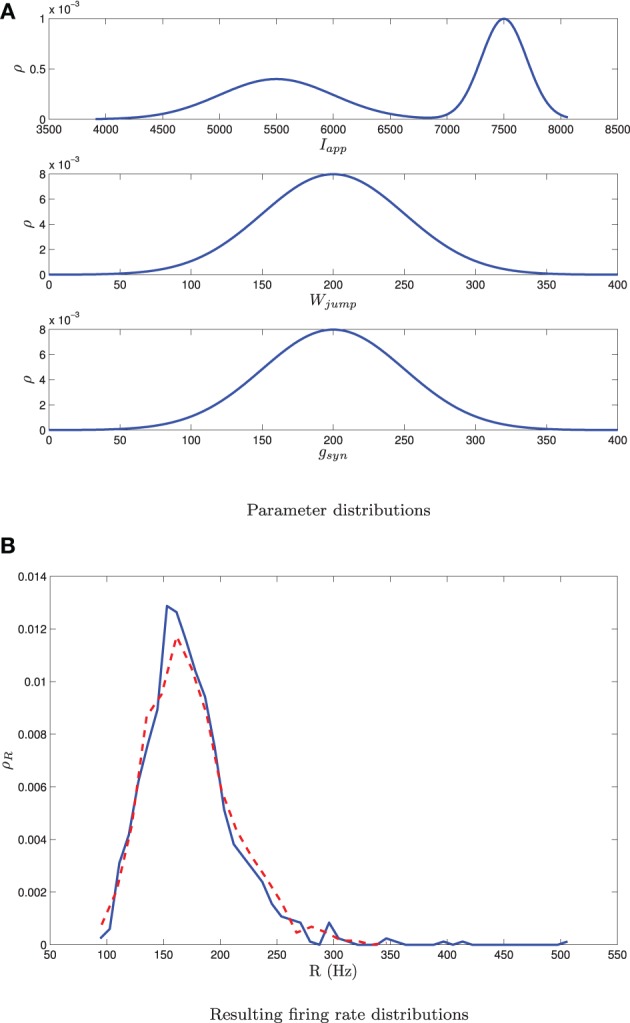
Figure 12.

A bimodal distribution in Iapp together with unimodal distributions in gsyn and Wjump as shown in (A) yields a unimodal distribution in the firing rate [dashed curve in (B)]. The mean-field equations give a good estimate of this distribution [solid curve in (B)]. Simulations are for network of 1000 neurons. parameter given in Table 1 except I, g, and Wjump. These are distributed with σw = 50, 〈Wjump〉 = 200, σg = 50, 〈gsyn〉 = 200, m = 0.5, 〈Iapp, 1〉 = 7500, σI, 1 = 200, 〈Iapp, 2〉 = 5500, σI, 2 = 500. Other combinations of bimodal and unimodal parameter distributions may yield bimodal firing rate distributions. Note that this is different than the situation shown in Figure 9, where a single bimodal source of heterogeneity yielded a bimodal firing rate distribution.
