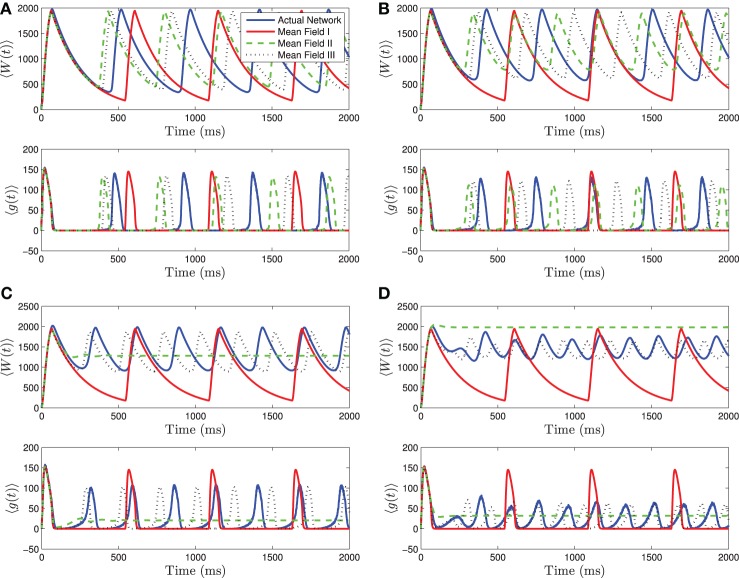
Figure 4.
Numerical simulations of a network of 1000 neurons with parameters as in Table 1, except gsyn = 200 and the applied current which is normally distributed with mean and variance as follows. (A) 〈Iapp〉 = 1200 pA, σI = 200 pA. (B) 〈Iapp〉 = 1200 pA, σI = 500 pA. (C) 〈Iapp〉 = 1200 pA, σI = 1000 pA. (D) 〈Iapp〉 = 1200 pA, σI = 2000 pA. Blue is the network average of a given variable, red is MFI, green is MFII, and black is MFIII. In these simulations, the mean-driving current is close to (and over) the rheobase. In all cases, MFI is the least accurate. This is because it depends only on 〈Iapp〉. When 〈Iapp〉 = O(Irh), even for small variance, many of the neurons have I < Irh and may not spike at all. (A,B) For small values of σI, all three approximations are qualitatively and quantitatively accurate. (C,D) For larger variance, σI = O(Irh), only MFIII is qualitatively and quantitatively accurate. In this case, MFII bifurcates early to tonic firing.

