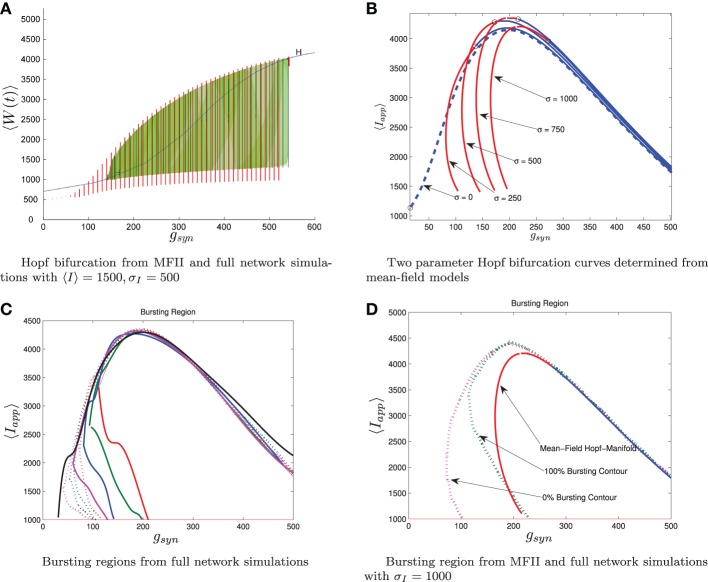
Figure 7.
Comparison between numerical bifurcation analysis of MFII and direct simulation of the full network. The parameters are as in Table 1, except gsyn varies as discussed below and the applied current which is normally distributed with mean and variance as discussed below. (A) Simulations of a network of 10,000 neurons with 〈Iapp〉 and σI as shown were run at discrete values of gsyn for 2000 ms. The last 400 (ms) of simulation time is plotted (in red), showing the stable limit cycle oscillation for different gsyn values. This is compared to numerical continuation of the MFII limit cycle and equilibrium (in green and blue). Both the actual network and MFII appear to undergo a supercritical Hopf bifurcation for low g values and a subcritical Hopf for high g values. (B) The Hopf bifurcation curves for the mean-field systems with σI as shown. Red denotes supercritical Hopf bifurcations and blue denote subcritical Hopf bifurcations. The black circles denote codimension 2 Bautin bifurcation points. (C) Simulations of a network of 1000 neurons run on a discrete mesh of 〈Iapp〉 and gsyn values. The 0% (dotted line) and 100% (solid line) network bursting contours for σI = 0, 250, 500, 750, and 1000 pA are colored in black, magenta, blue, green, and red, respectively. The curves are spline fits to the actual contours. (D) MFII Hopf bifurcation curves and spline fits to the 0% bursting and 100% bursting contours of the actual network for σI = 1000.

