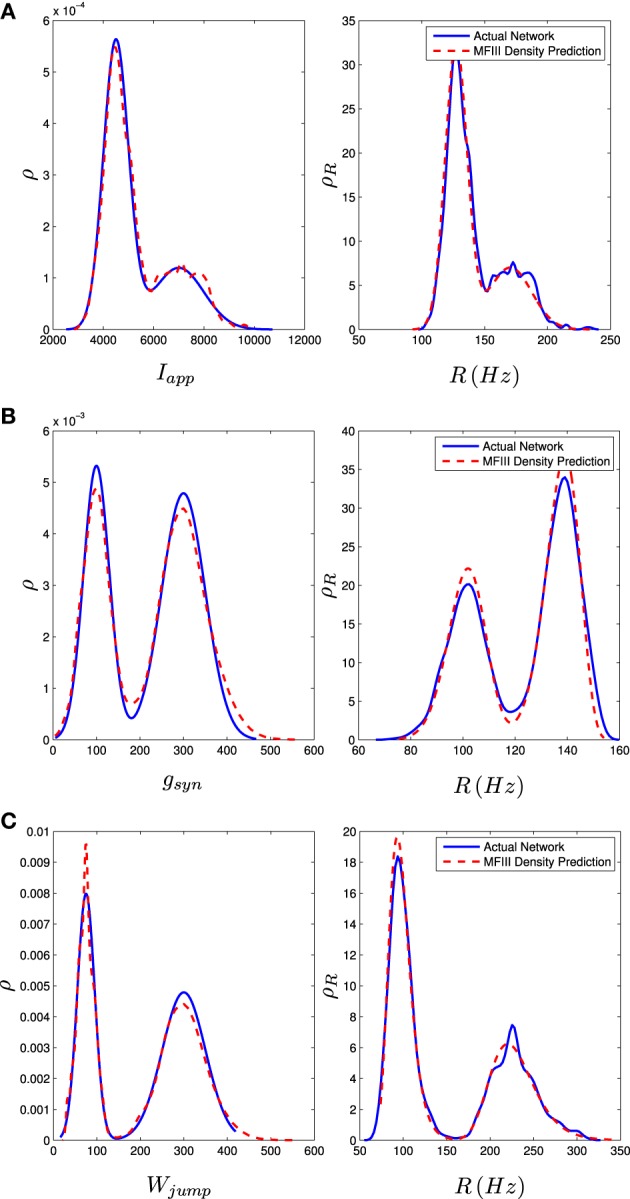
Figure 9.

Bimodal distributions in Iapp, gsyn, and Wjump lead to bimodal distributions in the firing rate. These bimodal parameter distributions are generated through distribution mixing of two normal subpopulations with standard deviations and means as given below. See Appendix C for details. The distribution of the firing rate or the distribution of the parameter can be computed using MFIII if one knows the complementary distribution. See sections 3.2.2 and 3.2.3 for details. Curve descriptions are as given in Figure 8. Parameters, other than those given below, can be found in Table 1. The calculations were carried out on a network of 1000 neurons. (A) Distribution of Iapp with μ1 = 4500 pA, σ1 = 500 pA, μ2 = 7000 pA, σ2 = 1000 pA, m = 0.7. (B) Distribution of gsyn with μ1 = 100 nS, σ1 = 30 nS, μ2 = 300 nS, σ2 = 50 nS, m = 0.4. (C) Distribution of Wjump with μ1 = 300 pA, σ1 = 50 pA, μ2 = 75 pA, σ2 = 20 pA, m = 0.6.
