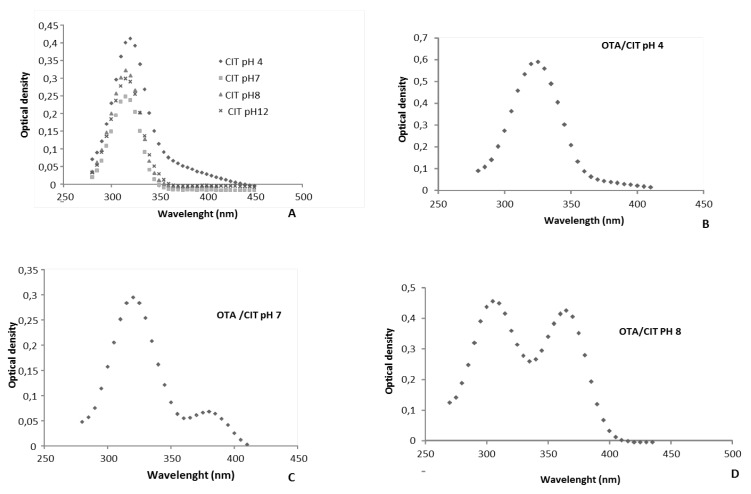
Figure 4.
UV-Spectra of citrinin and ochratoxin A in mixture: Curve A represents the spectrum of CIT at four pH (4, 7, 8 and 12). Curve B represents the spectrum of CIT in mixture with OTA at pH 4. Curve C represents the spectrum of CIT in mixture with OTA at pH 7. Curve D represents the spectrum of CIT in mixture with OTA at pH 8.

