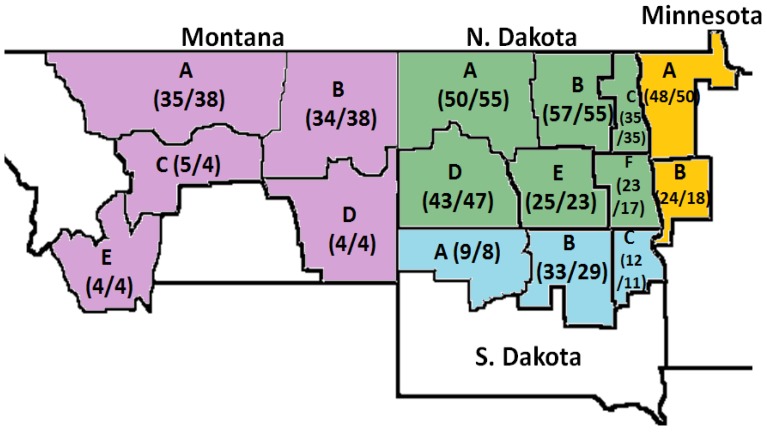
Figure 1.
Distribution of hard red spring (HRS) wheat samples from the 2011 and 2012 Crop Surveys from Montana, North Dakota, Minnesota and South Dakota. A, B, C, D, E and F: regions in which the samples were collected from each state. The numbers inside the parenthesis represent the number of samples taken, from left to right: 2011 Crop Survey and 2012 Crop Survey.

