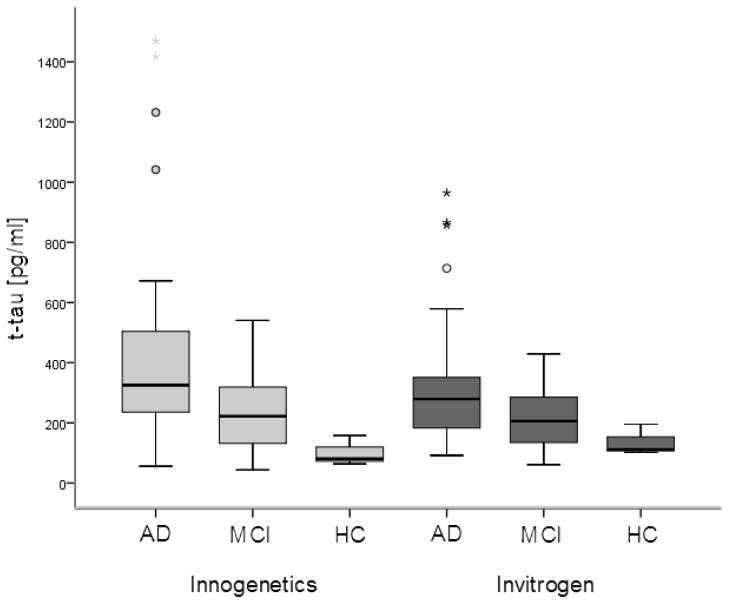
Figure 1.
CSF t-tau levels in AD, MCI and HC subjects measured by Innogenetics and Invitrogen ELISA kit. Boxes represent the median, the 25th and the 75th percentiles, bars indicate the range of data distribution. Circles represent outliers (values more than 1.5 box-length from the 75th/25th percentile). The asterisks represent extreme values (value more than three box-length from the 75th/25th percentile).

