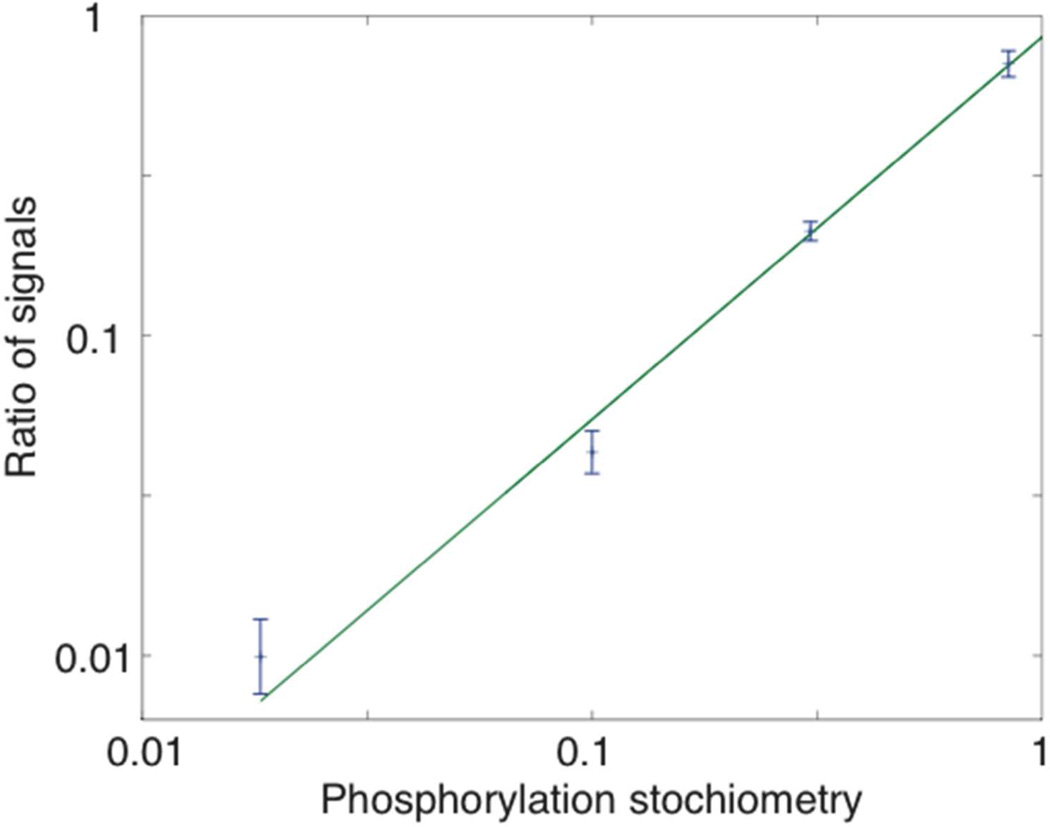
Figure 3.
Log-log calibration curve for unphosphorylated and mono-phosphorylated standards with different phosphorylation stoichiometries. Data are plotted as ± 1 standard deviation of the mean, n = 3 for each stoichiometry. The smooth curve is the weighted least squares fit of a linear polynomial to the logarithm of the data. Results of the fit are summarized in Table 1.

