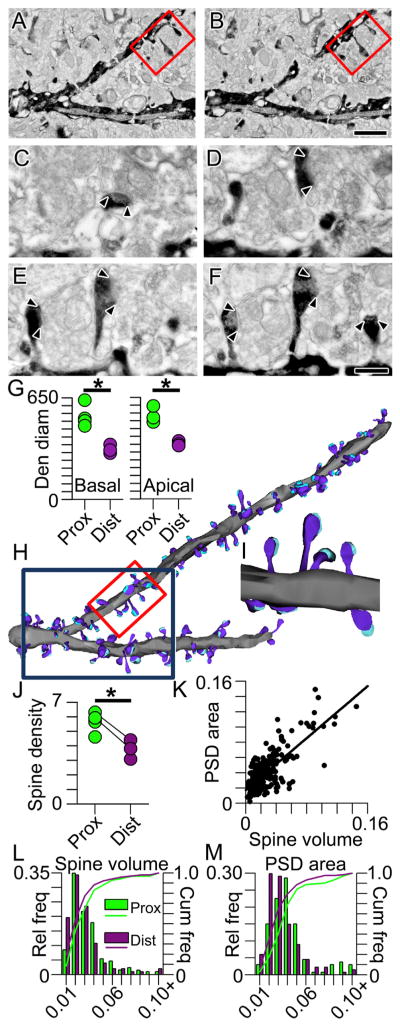
Figure 1. Intradendritic Scaling of Spines and Synapses Using Reconstructive Electron Microscopy.
(A and B) Serial electron micrograph mosaics through a BDA-labeled proximal branch segment with spines and synapses. Red boxed region denotes the higher magnification images depicted in (C)–(F). Scale bar represents 1 μm, also applies to (H).
(C–F) Higher-magnification series through red boxed region in (A) and (B). Arrowheads indicate boundaries of each postsynaptic density (PSD). Scale bar represents 0.25 μm, also applies to (I).
(G) Dendritic diameters measured on electron microscopically reconstructed dendritic segments from proximal (green) and distal (purple) portions of basal (left) and apical (right) dendrites. Asterisk indicates that proximal dendrites have significantly larger diameters than distal dendrites. In all figures, group data are represented as means ± SEM.
(H) Lower-magnification three-dimensional reconstructions of the two dendritic branch segments shown at higher magnification in (C)–(F). The red boxed segment is the same portion of the dendrite shown in serial sections in (C)–(F) and reconstructed in (I); the dark blue box denotes the dendritic segment shown in (A) and (B).
(I) Three-dimensional reconstructions of spines (dark blue), their synapses (cyan), and their parent dendrite (gray) from micrographs shown in (C)–(F).
(J) Scatter plot showing spine densities on basal branch segments proximal (green) and distal (purple) to the soma. Connected circles represent segments from the same branch. Asterisk indicates that proximal segments have a significantly higher spine density than distal segments.
(K) Scatter plot showing the linear relationship between spine volume (on the abscissa) and PSD area (on the ordinate).
(L) Histograms showing the relative (bars) and cumulative (lines) frequencies of spine volumes in basal dendritic segments proximal (green) and distal (purple) to the soma.
(M) Same as (L) but for PSD area.

