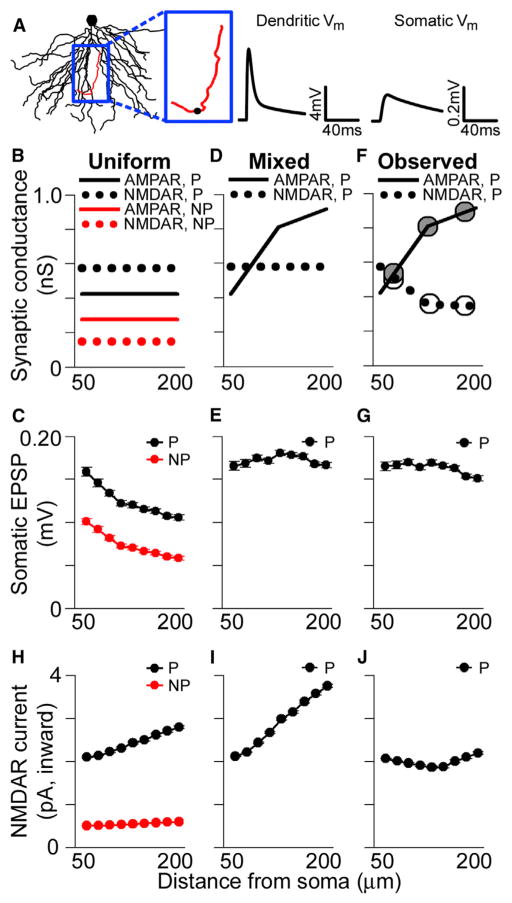
Figure 4. Location-Independent Contribution of Individual Perforated Synapses to Subthreshold Somatic Voltage.
(A) Basal dendritic tree of a reconstructed CA1 pyramidal neuron. Voltage traces are the local EPSP (left) and the somatic EPSP (right) in response to an activated synaptic conductance located on the red dendrite (depicted as a black circle).
(B) AMPAR- and NMDAR-mediated conductance values used in the uniform case for simulated nonperforated (NP) and perforated (P) synapses at varying distances from the soma.
(C) Average amplitudes of simulated unitary somatic EPSPs in response to activated perforated (black) and nonperforated (red) synaptic conductances at various distances from the soma using uniform parameters. All group data are represented as means ± SEM.
(D) AMPAR- and NMDAR-mediated conductance values using in the “mixed” case for simulated perforated synapses.
(E) Average amplitudes of simulated unitary somatic EPSPs in response to activated perforated synaptic conductances at various distances from the soma using the “mixed” conductance values.
(F) Experimentally observed AMPAR- and NMDAR-mediated synaptic conductances for perforated synapses. Superimposed circles show the conductances for pSO, mSO, and dSO obtained directly from the particle number data for AMPARs (gray circles) and NMDARs (white circles).
(G) Average amplitudes of simulated unitary somatic EPSPs in response to activated perforated synaptic conductances scaled according to experimentally observed AMPAR and NMDAR expression patterns.
(H–J) Peak local NMDAR-mediated current for the different conditions shown in (B), (D), and (F).

